Transfer functions of various reasonable and unreasonable graphic EQ settings.
Please Remember:
The opinions expressed are mine only. These opinions do not necessarily reflect anybody else’s opinions. I do not own, operate, manage, or represent any band, venue, or company that I talk about, unless explicitly noted.

 Want to use this image for something else? Great! Click it for the link to a high-res or resolution-independent version.
An aphorism that I firmly believe goes like this: “If you can hear it, you can measure it.” Of course, there’s another twist to that – the one that reminds you that it’s possible to measure things you can’t hear.
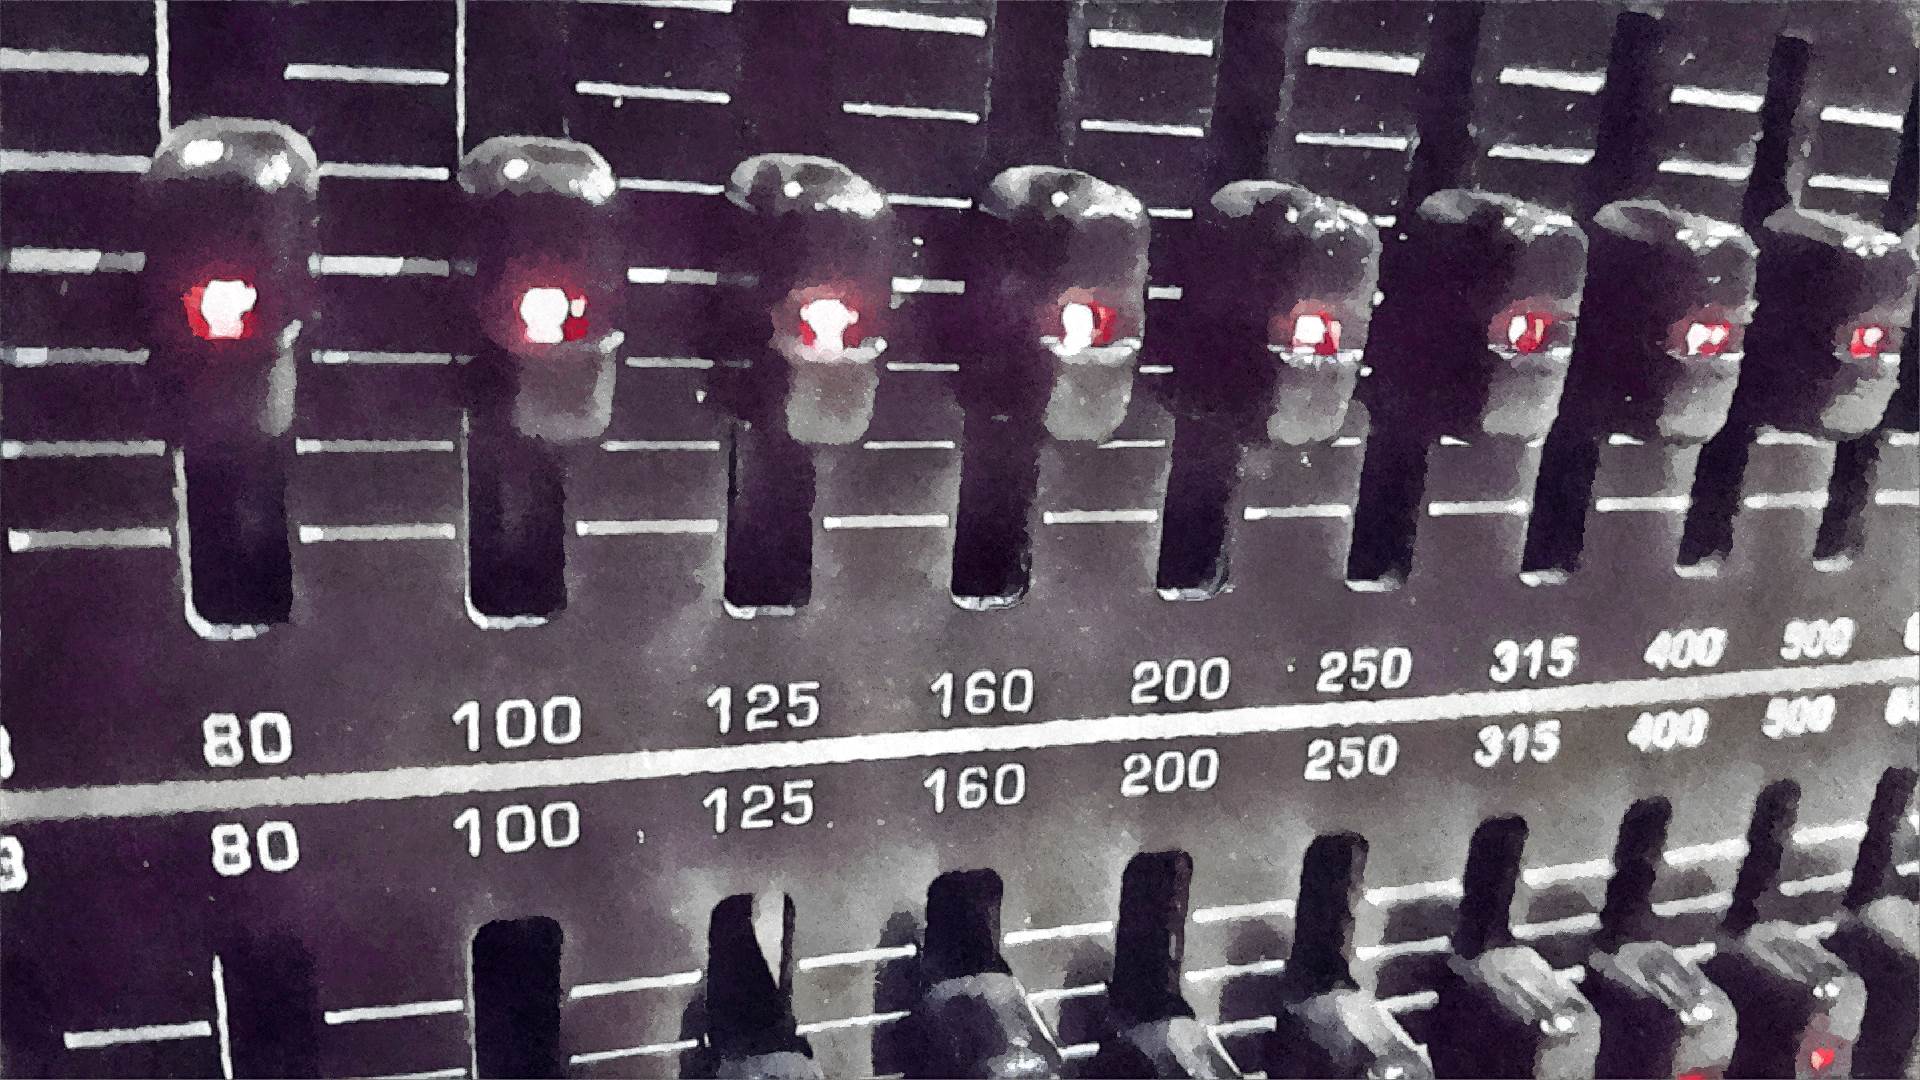
The graphic equalizer, though still recognizable, is losing a bit of its commonality as an outboard device. With digital consoles invading en masse, making landings up and down the treasure-laden coasts of live audio, racks and racks of separate EQ devices are being virtualized inside computer-driven mix platforms. At the same time, hardware graphics are still a real thing that exists…and I would wager that most of us haven’t seen a transfer function of common uses (and abuses) of these units, which happen whether you’ve got a physical object or a digital representation of one.
So – let me dig up a spare Behringer Ultragraph Pro, and let’s graph a graphic. (An important note: Any measurement that you do is a measurement of EXACTLY that setup. Some parts of this exercise will be generally applicable, but please be aware that what we’re measuring is a specific Behringer EQ and not all graphic EQs in the world.)
The first thing to look at is the “flat” state. When you set the processing to “out,” is it really out?
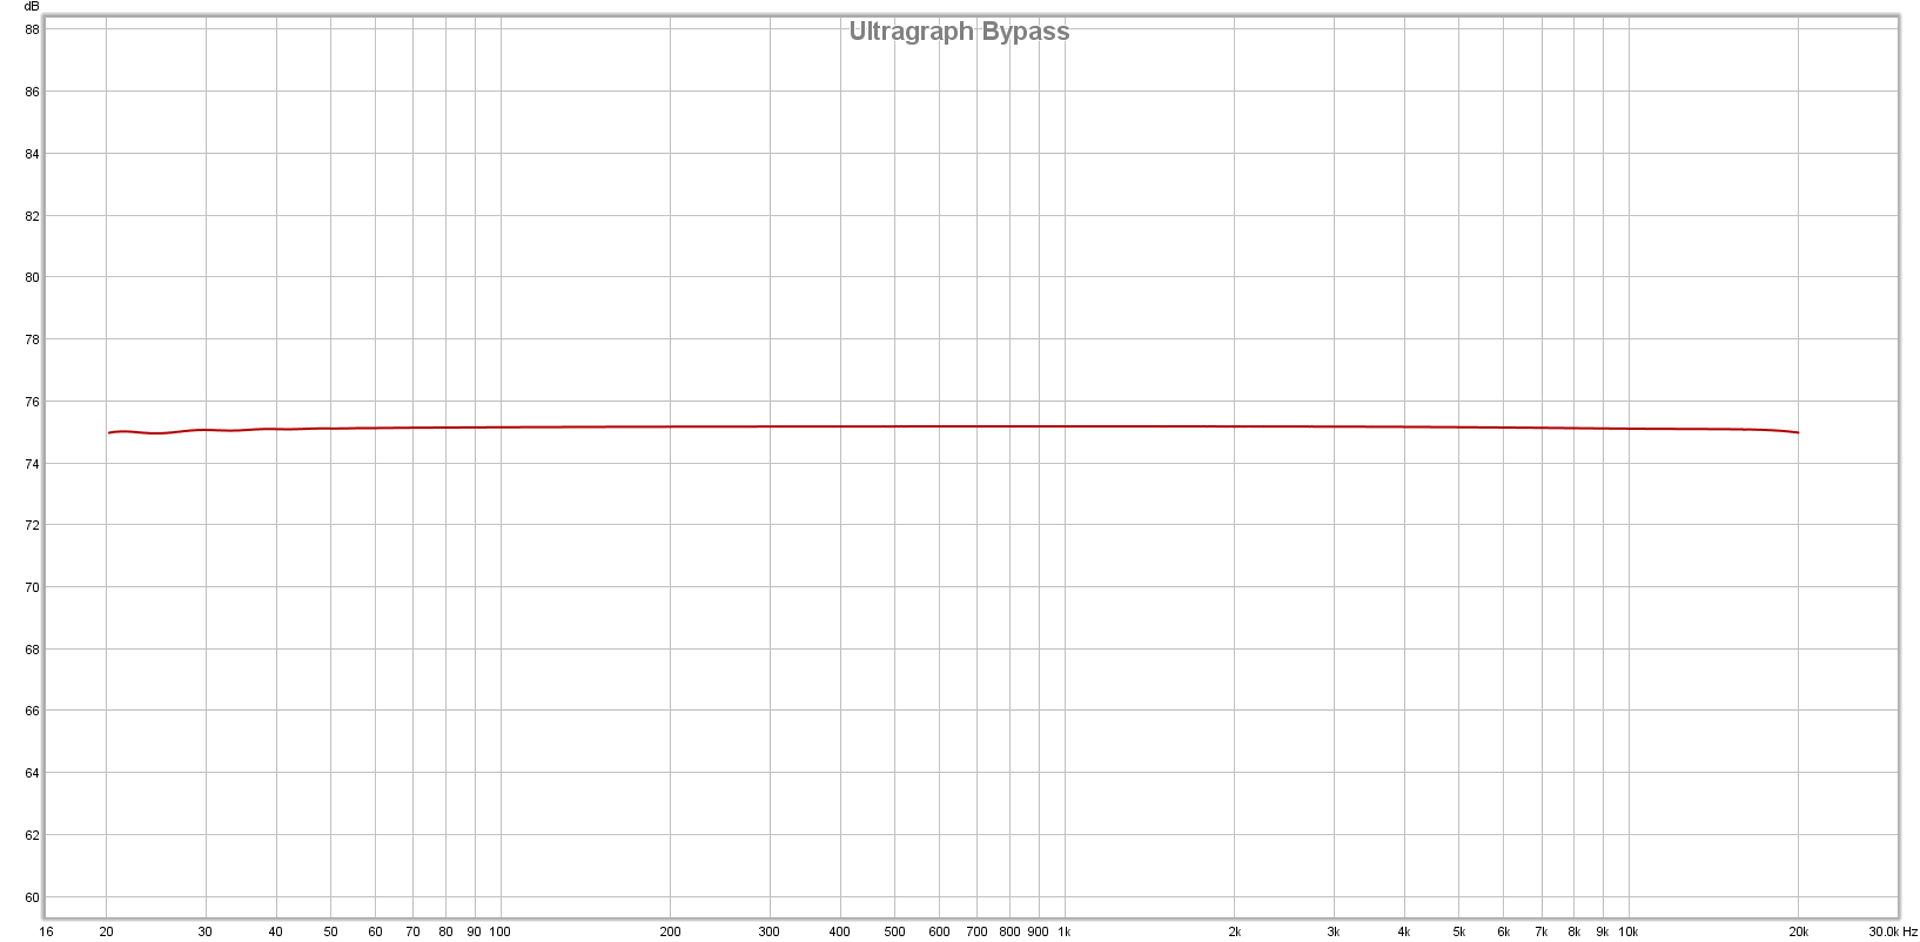
In this case, very much so. The trace is laser flat, with +/- 0.2 dB of change across the entire audible spectrum. It’s indistinguishable from a “straight wire” measurement of my audio interface.
Now, we’ll allow audio to flow through the unit’s filtering, but with the high and low-pass filters swept to their maximums, and all the graph filters set to 0 dB.
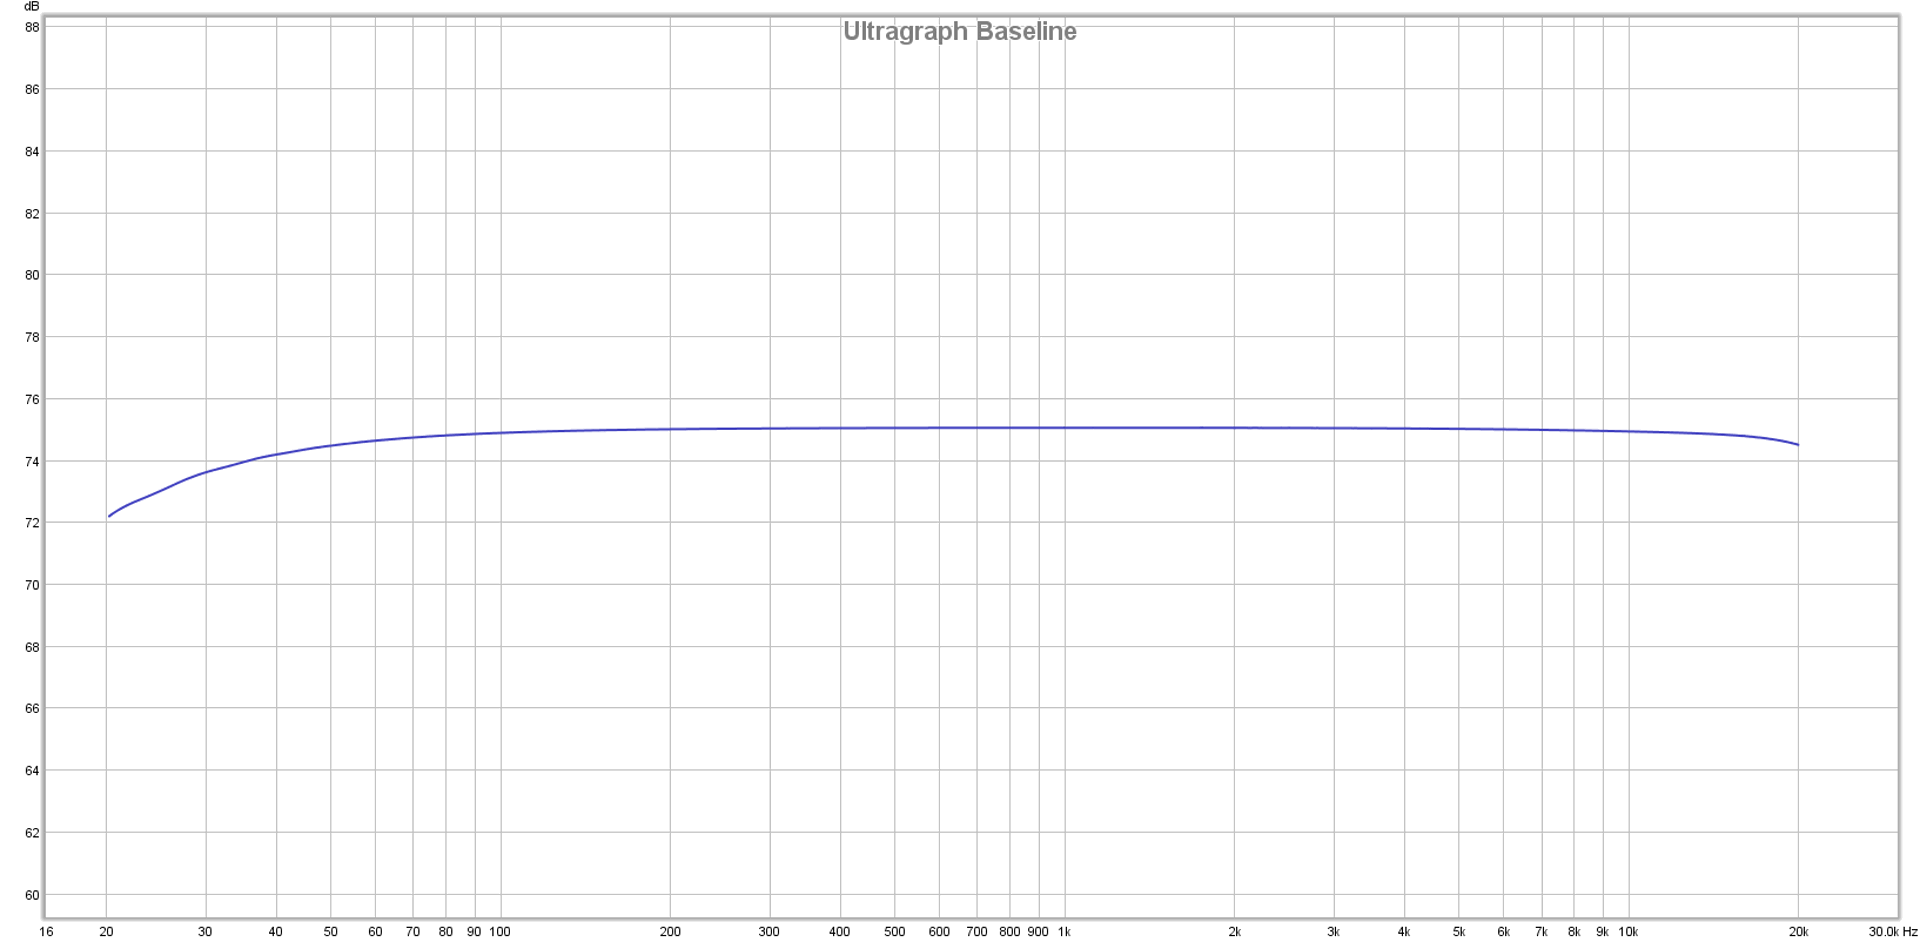
The low and high-pass filters are still definitely having an effect in the audible range, though a minimal one. Half a decibel down at 45 Hz isn’t nothing, but it’s also pretty hard to hear.
What happens when the filters are swept to 75 Hz and 10 kHz?
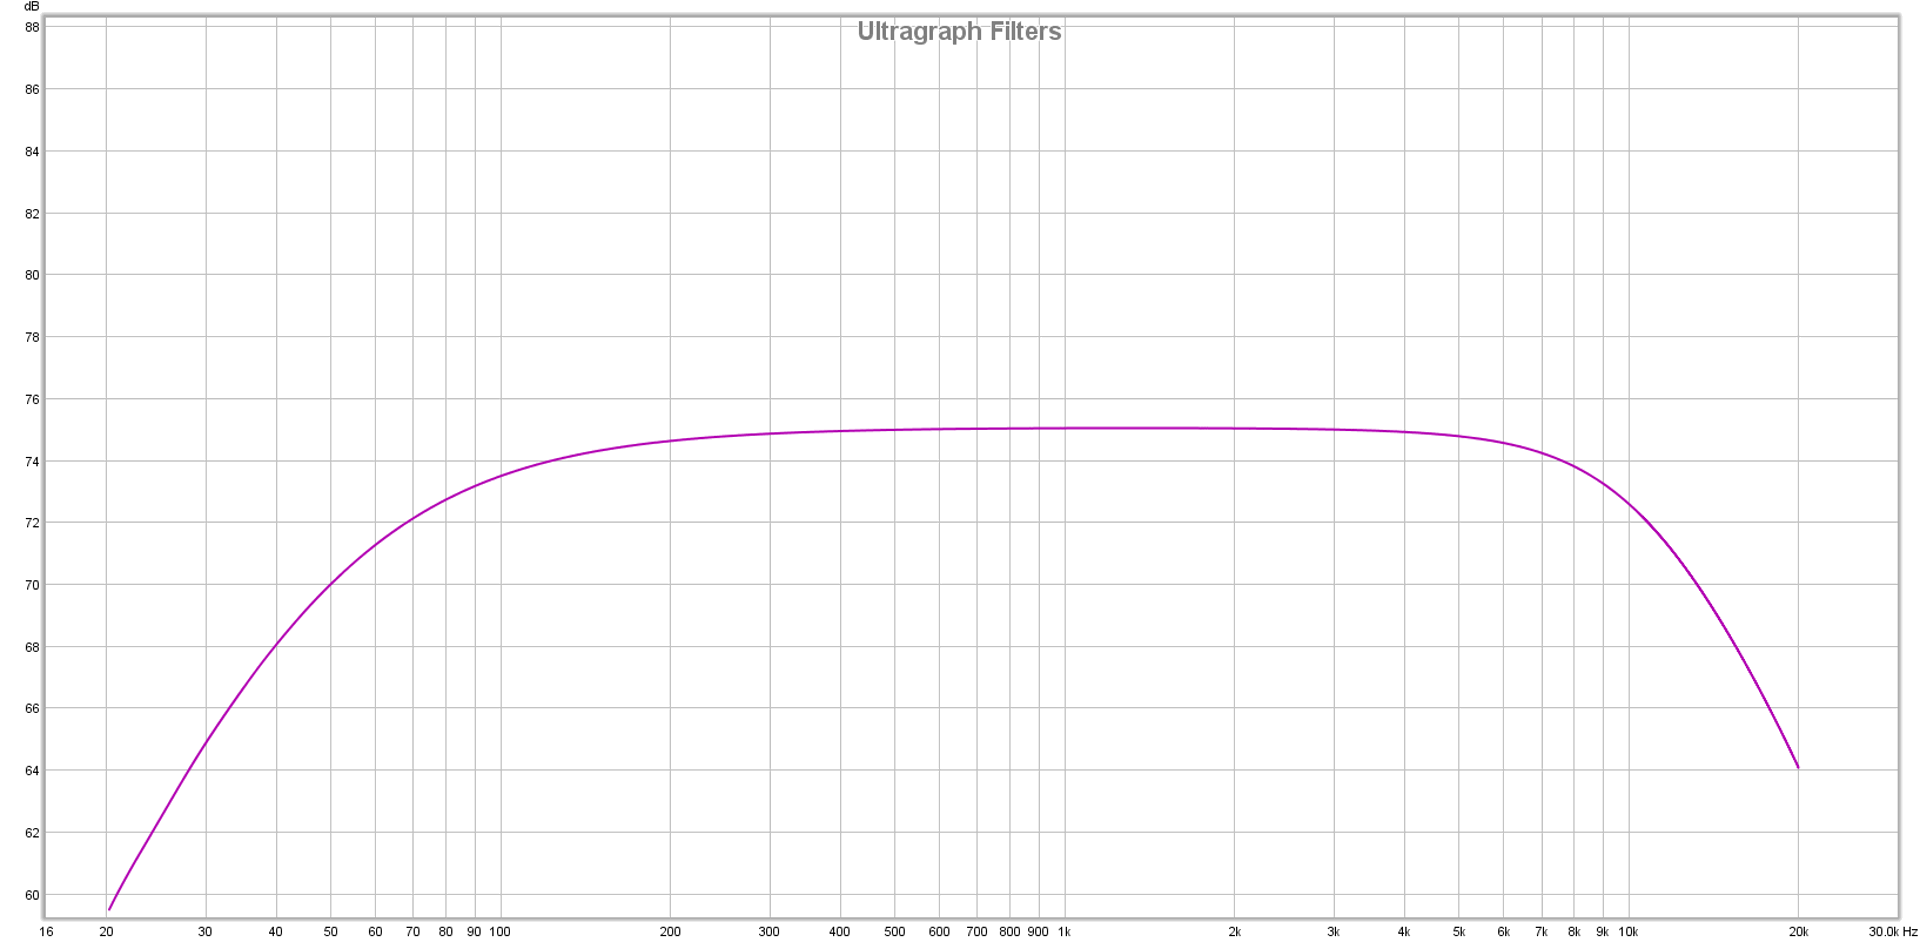
The 3dB points are about where the labeling on the knobs tells you it should be (with a little bit of overshoot), and the filters roll off pretty gently (about 6 dB per octave).
Let’s sweep the filters out again, and make a small cut at 500 Hz.
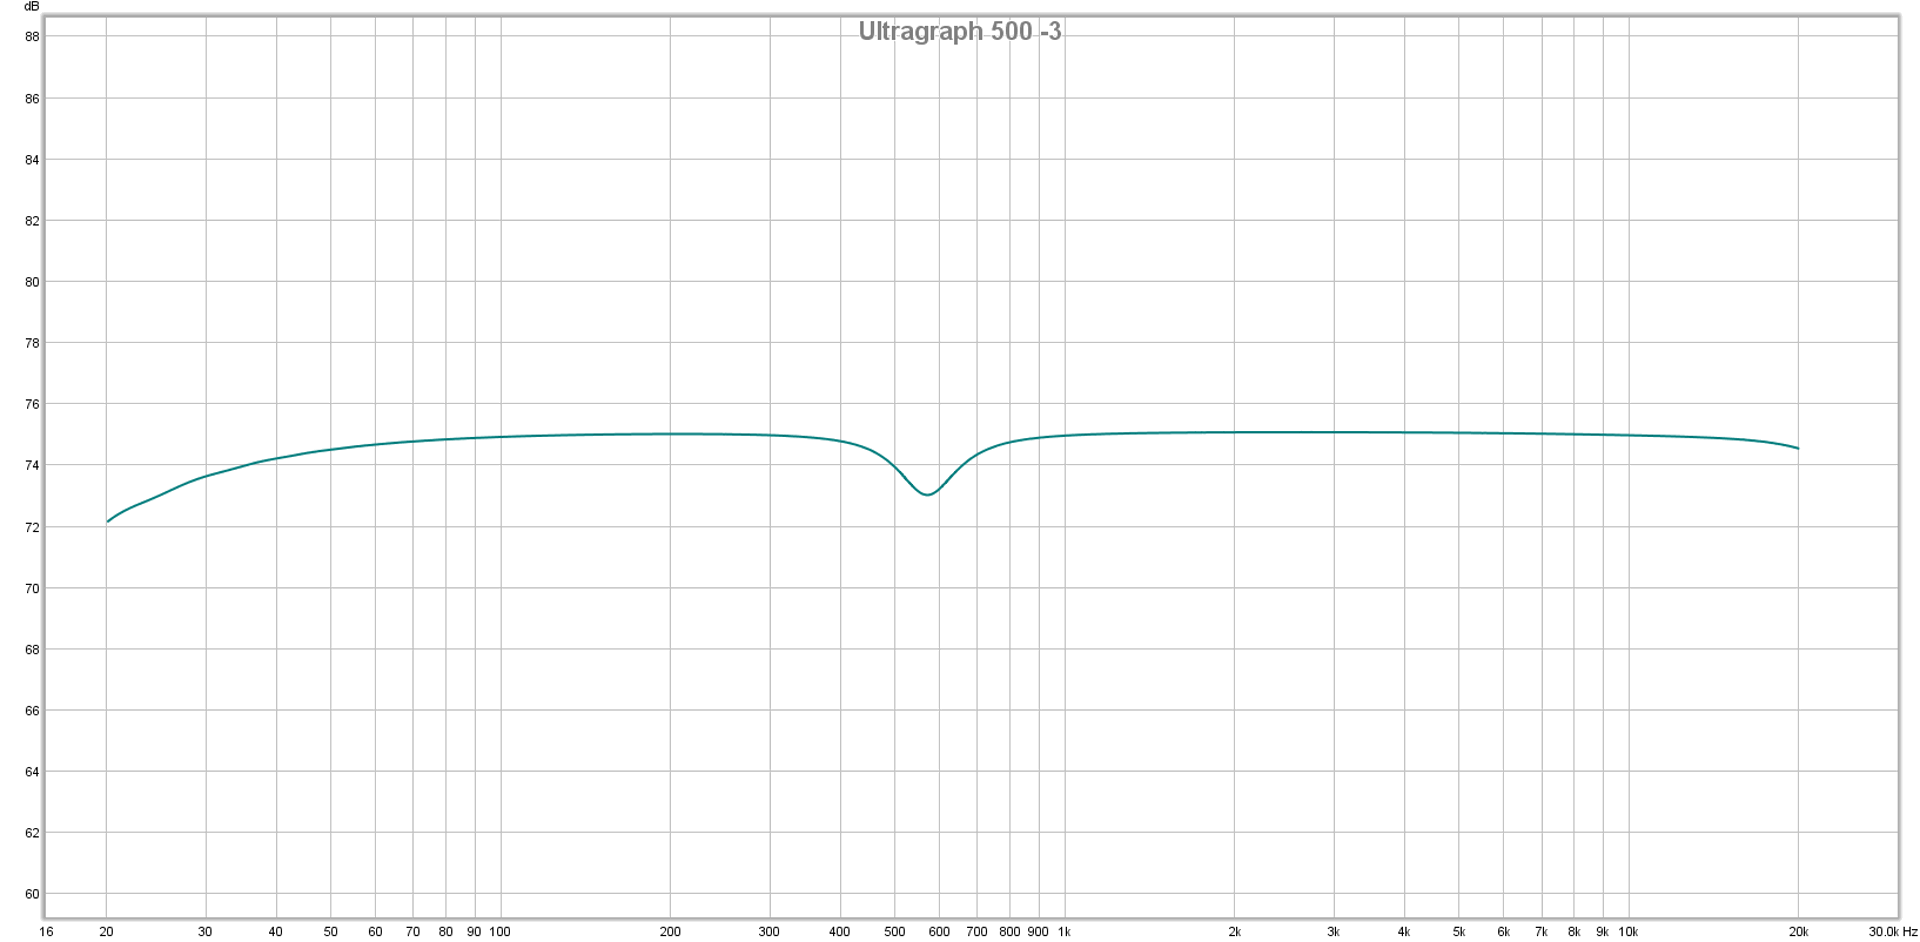
Interestingly, the filter doesn’t seem to be located exactly where the faceplate says it should be – it’s about 40% of a third-octave space away from the indicated frequency center, if the trace is accurate in itself.
What if we drop the 500 Hz filter all the way down, and superimpose the new trace on the old one?
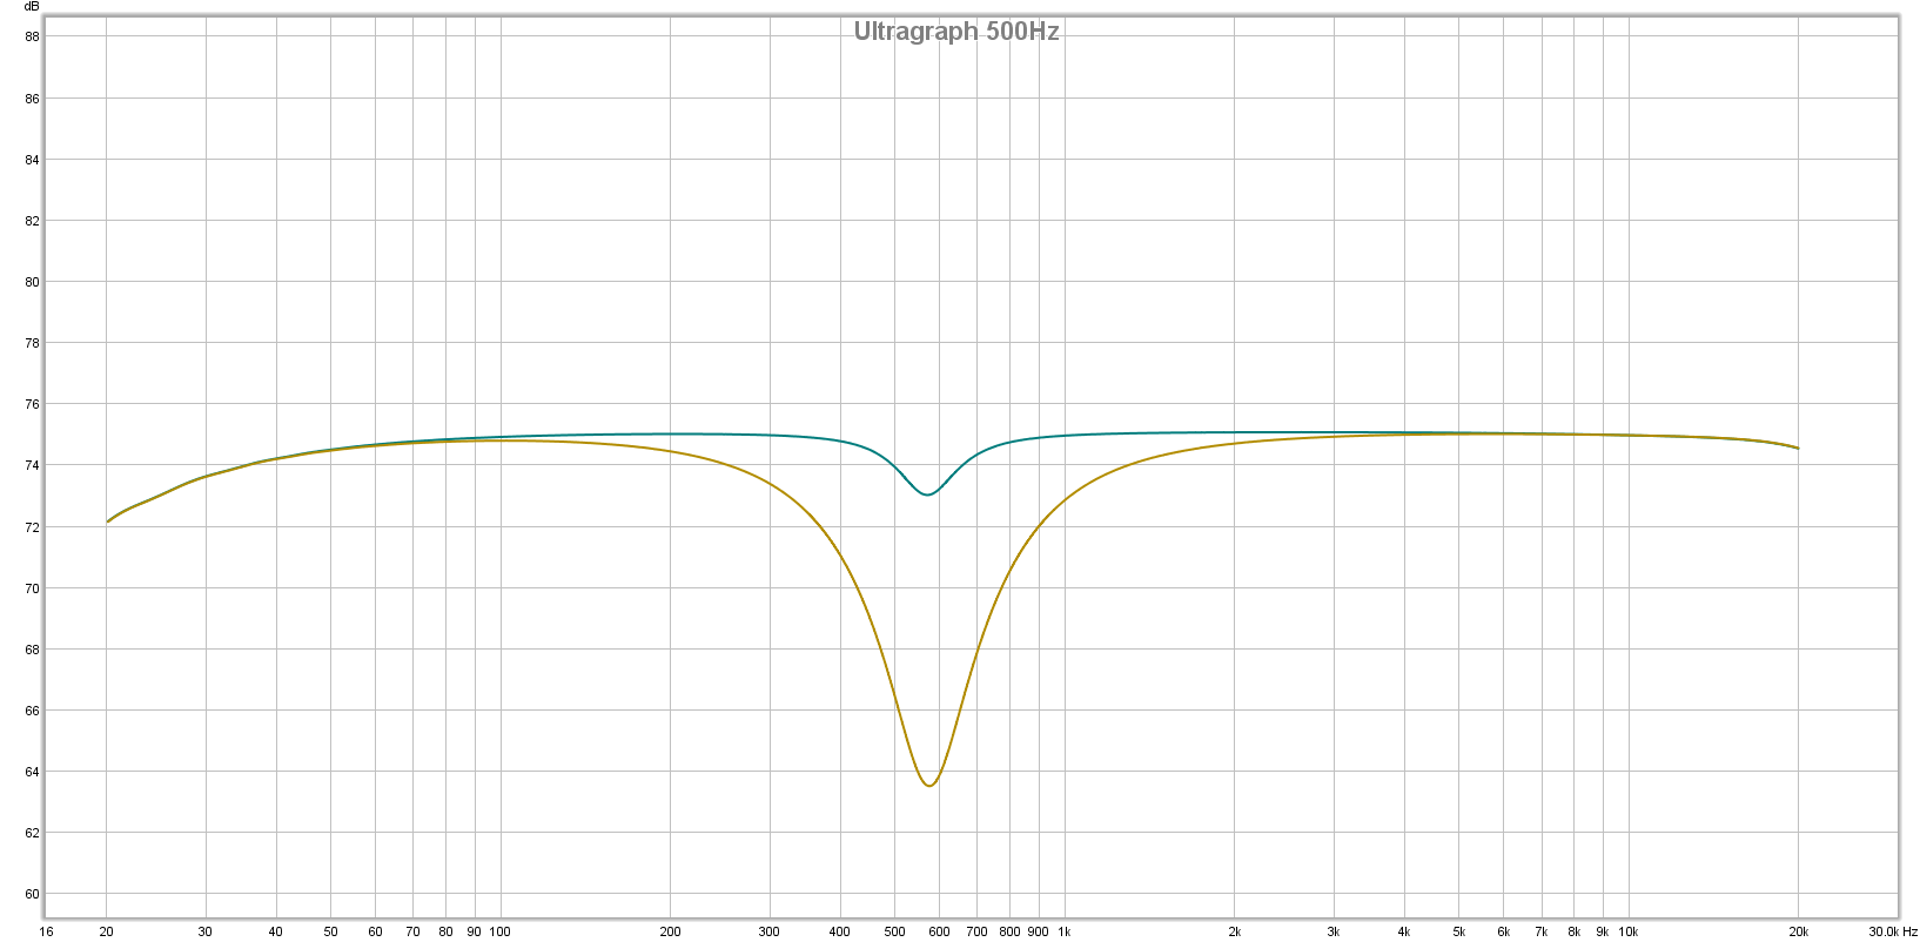
The filter might look a bit wider than what you expected, with easily measurable effects happening at a full octave below the selected frequency. Even so, that’s pretty selective compared to lots of wide-ranging, “ultra musical” EQ implementations you might run into.
What happens when we yank down two filters that are right next to each other?

There’s an interesting ripple between the cuts, amounting to a little bit less than 1 dB.
How about one of the classic graphic EQ abuses? Here’s a smiley-face curve:
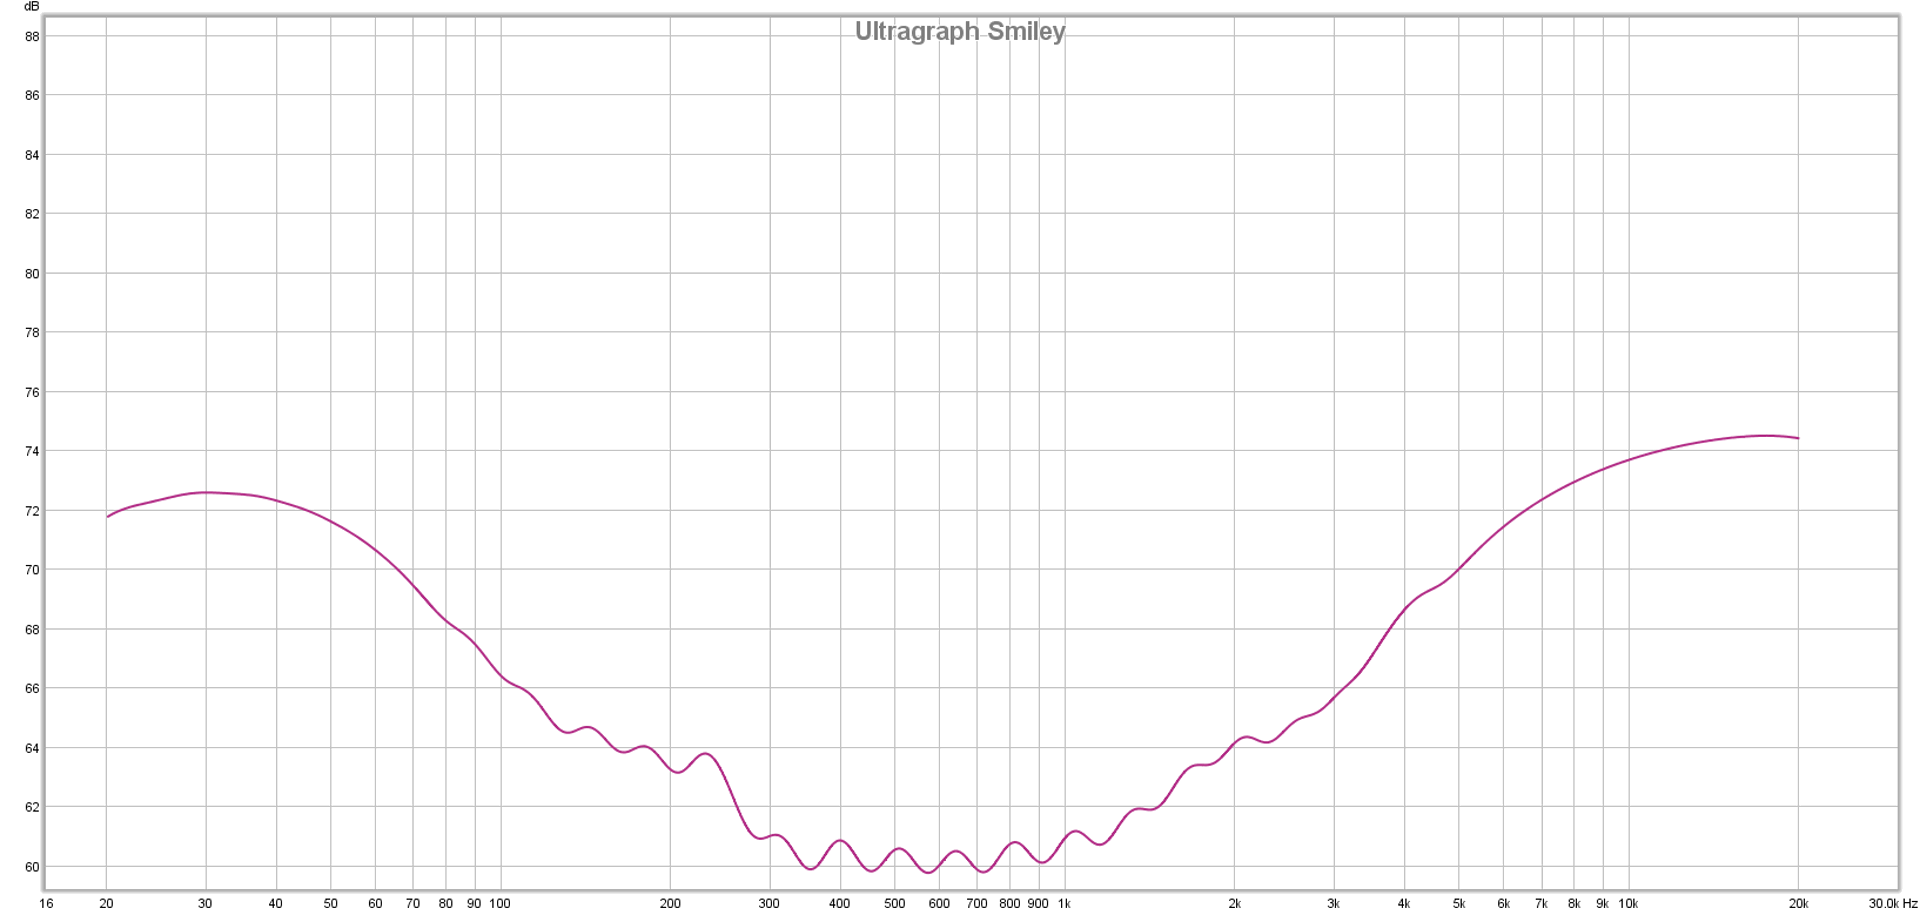
Want to destroy all semblance of headroom in an audio system? It’s easy! Just kill the level of the frequency range that’s easiest to hear and most efficient to reproduce, then complain that the system has no power. No problem! :Rolls Eyes:
Here’s another EQ abuse, alternately called “Death To 100” or “I Was Too Cheap To Buy A Crossover:”
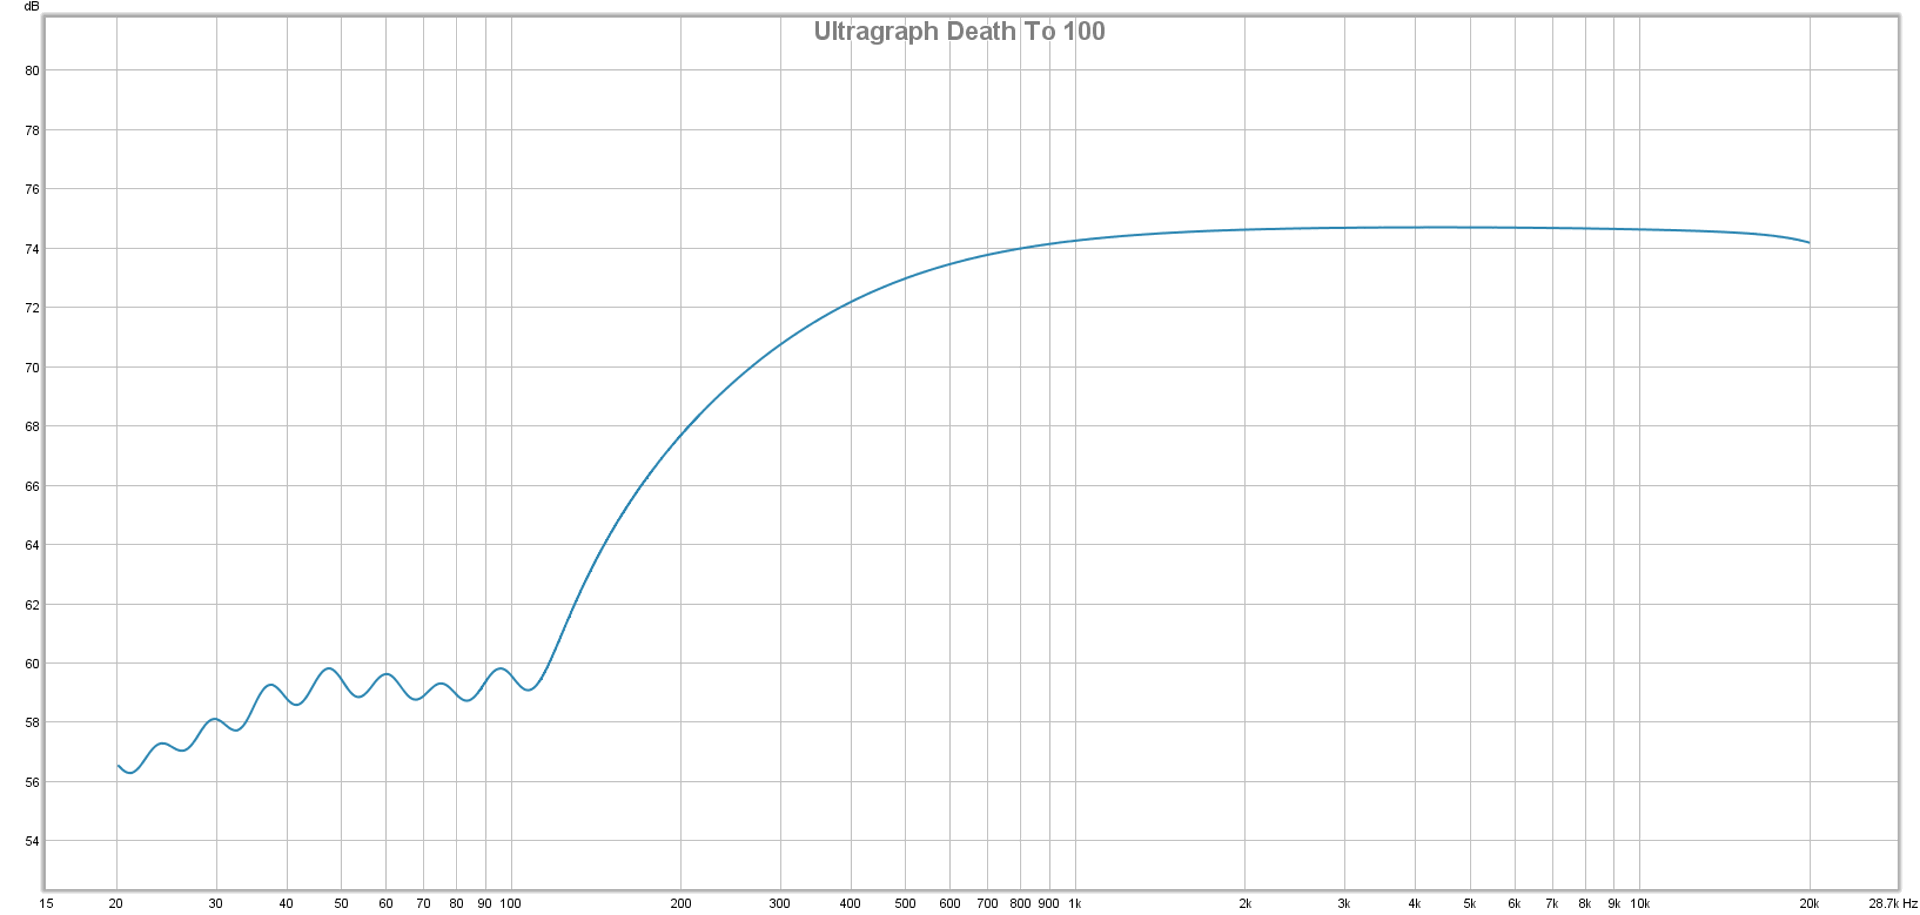
It could be worse, true, but…really? It’s not a true substitute for having the correct tool in the first place.