Please Remember:
The opinions expressed are mine only. These opinions do not necessarily reflect anybody else’s opinions. I do not own, operate, manage, or represent any band, venue, or company that I talk about, unless explicitly noted.

 Want to use this image for something else? Great! Click it for the link to a high-res or resolution-independent version.
(Important Note: After publishing, I finally realized that something was very wrong with my calculations. I put in a fix, and have documented it at the end of this article.)
The thing is, I really want to write about what happens when you build a line of drivers – how they interact acoustically. The problem is that my favorite, relatively easy to use acoustical prediction software was taken and made into an iOS-only app by somebody. (I am disappointed in that somebody. Maybe even angry.) Everything else that’s out there is overly complex for what I need to do.
Being a little nutty, I thought to myself: “Couldn’t you make something yourself that does what you need?”
Which is hilarious, because in the time it would take me to build my own calculator, I could probably figure out how to use one of the overly complex calculators in a minimal way. But whatever! I need to learn React to be a modern UI developer anyway, and this will help me on that road.
The first step in modeling a problem is figuring out how to represent it.
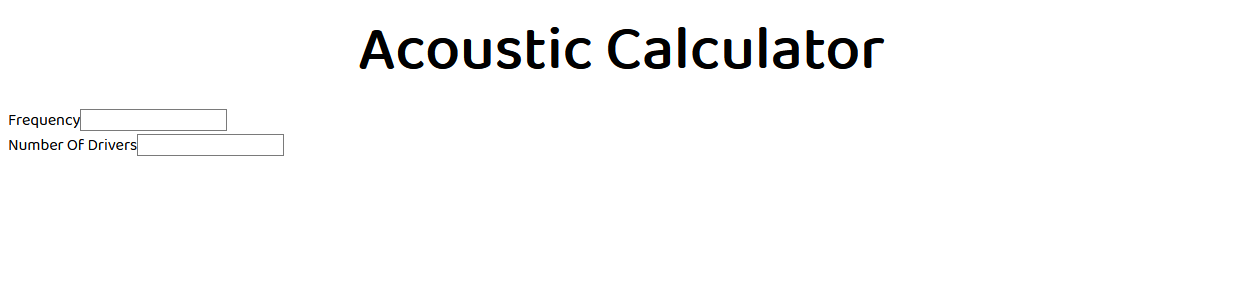
After some thinking, I determined that the first thing I needed was a way to input the frequency of interest, and how many drivers would be involved. That’s easy enough.
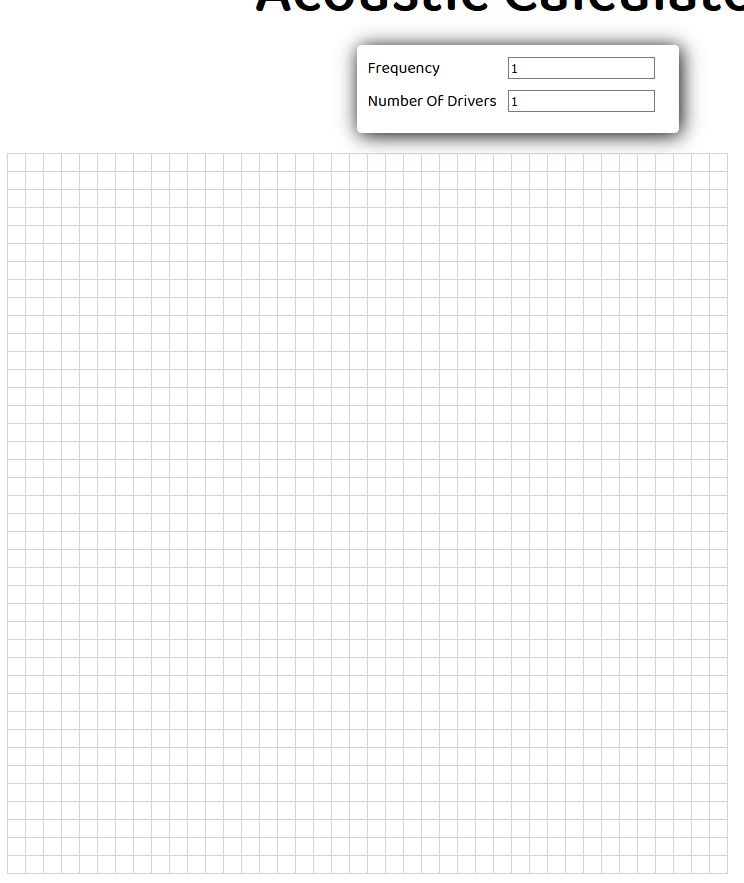
In acoustic calculation, what we’re trying to do is determine how much pressure we have at a given point in space. With any computer display, visually plotting that information involves a grid. To get started, I don’t need ultra-high resolution. A 100×100 array of boxes should do the trick, right?
That’s what I thought, until I saw it rendered in reality. Zoinks! A 40×40 grid is much better, and seems perfectly adequate if 20Hz waves aren’t really important to us. (A 20Hz wave is about 50ft long, and I’m going to be assuming that each grid box is about a foot square.)
After a good bit of futzing with React and CSS styling, I can see the grid.
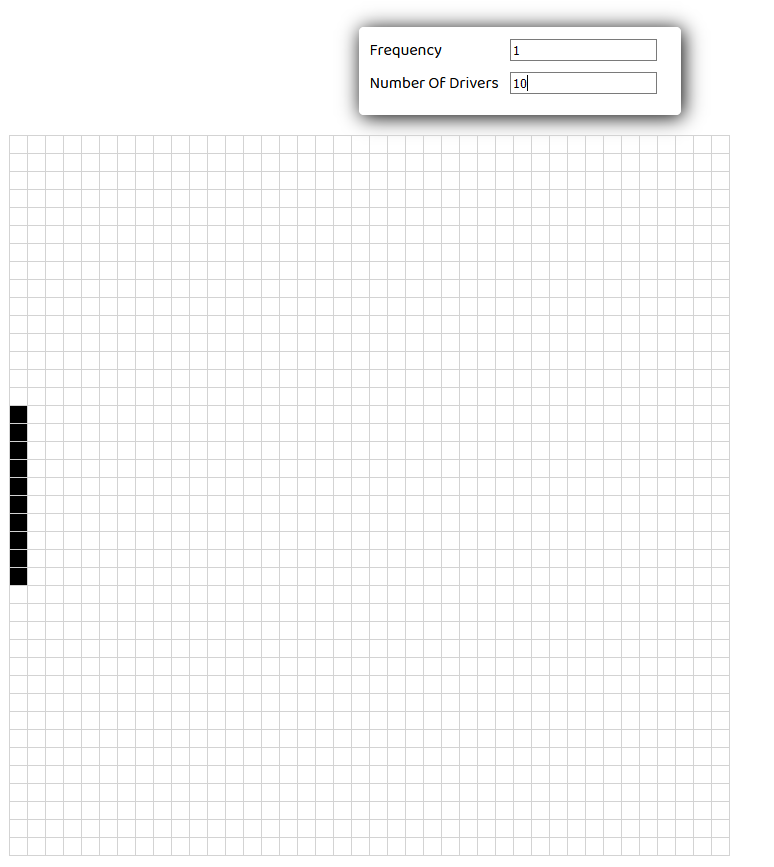
Now, I have to plot speaker positions. A really full-featured calculator would allow for arbitrary locations – but I’m in a hurry, so I’ll just place the speakers programmatically. I’m going to see if I can build a line along the left side of the grid, essentially centered vertically.
After a lot of bumbling around with offsets and a misuse of the addition operator, I finally get things to position themselves appropriately.
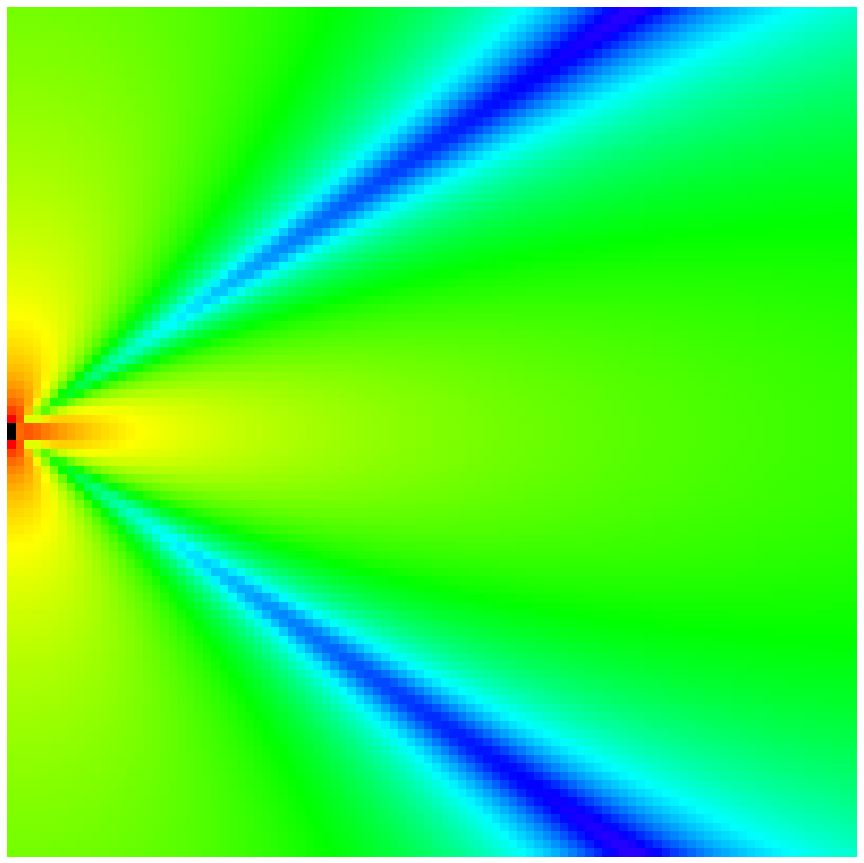
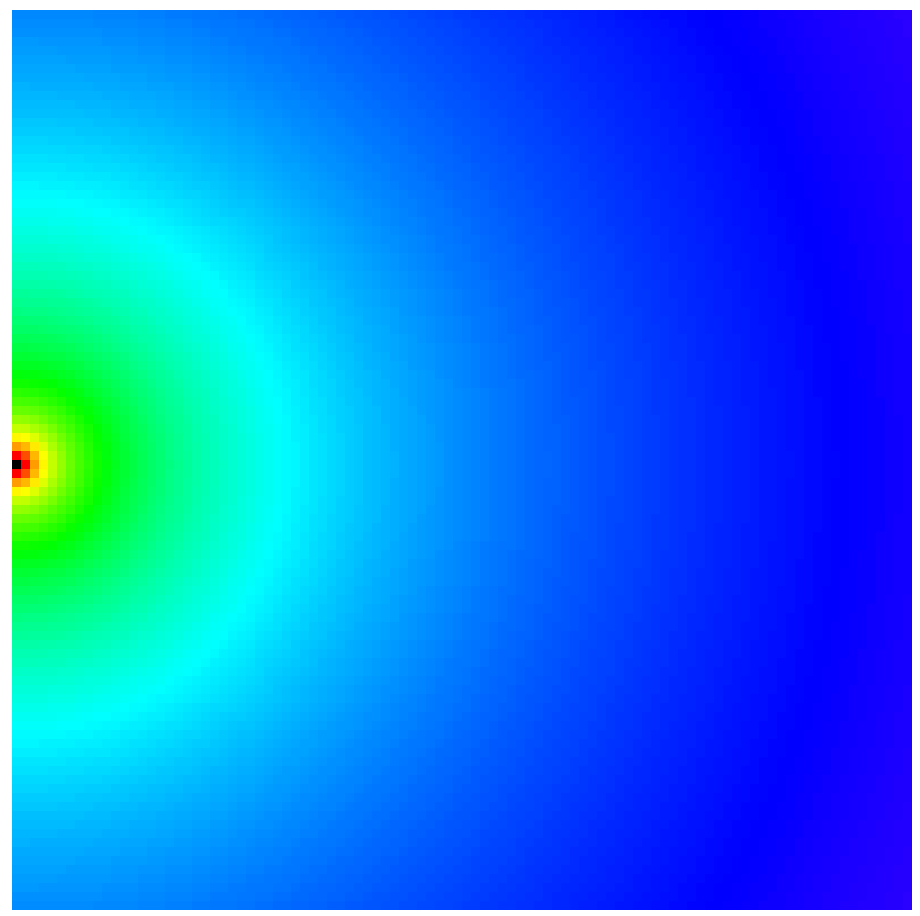
Of course, I wouldn’t be me if I didn’t change my mind. After getting the speakers to plot correctly, I decided that a higher-res grid was better, and also that I didn’t want gridlines. This was after I finished my code for abstract calculations and color plotting. Here’s what I got when plotting one speaker:
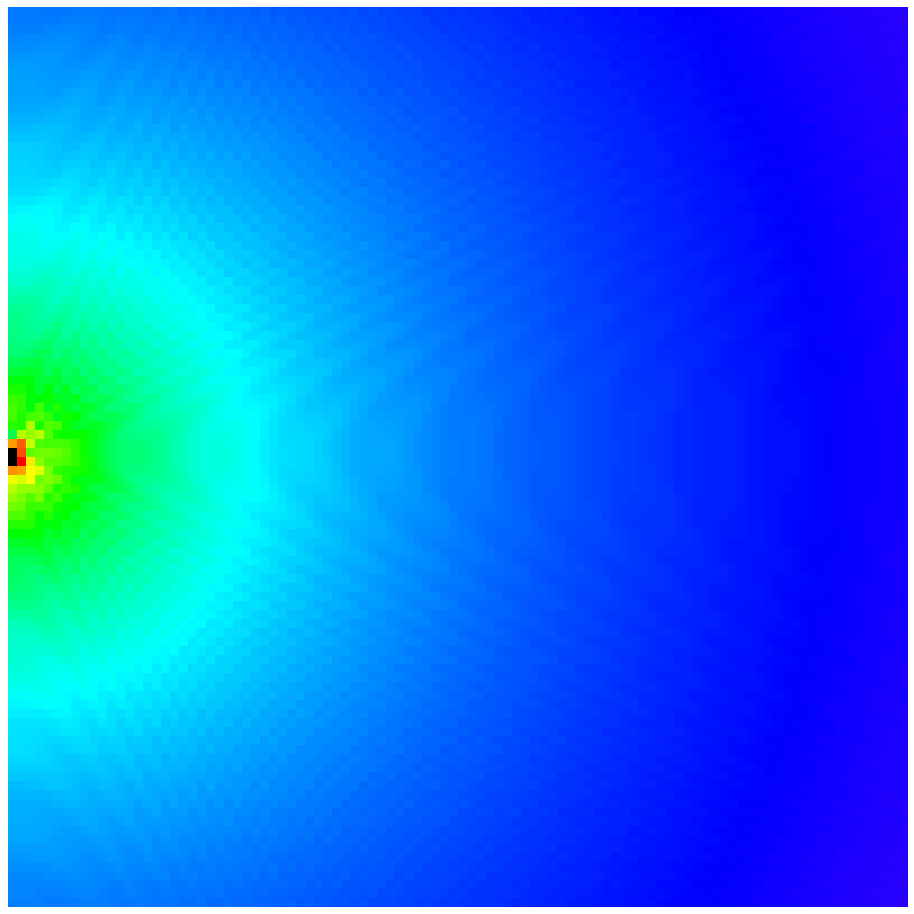
That looks about right to me. Plotting two speakers, though, seems wrong. The plot should be symmetrical, and it isn’t quite, plus the “cyclical waves” of intensity are just not how things work in real life. I think I’m going about my calculation incorrectly.
My debugging process was one of looking at my various interstitial values, and trying to figure out where they were different when they should have been the same. In the end, I made one very important determination: When calculating the phase difference and resulting pressure summation from driver to driver, the reference driver should always be the nearest one to the observation point. If you always start with, say, the first driver, the graph will bias off towards that sound source. Here’s my stab at an explanation for why:
Humans don’t experience a show from all points in space simultaneously, and omnisciently about a particular sound source being “first.” Instead, we experience the show from where we are, and whatever source of sound is the closest to us is the “0 phase” reference point.
What I’ve got now is much better. It still seems to have some issues, but my sneaky suspicion is that grid resolution and floating point math may be the final hindrance on the way to perfection.
Wait…no, that’s not right at all. Those two drivers should sum very handily in the middle. What’s going on?
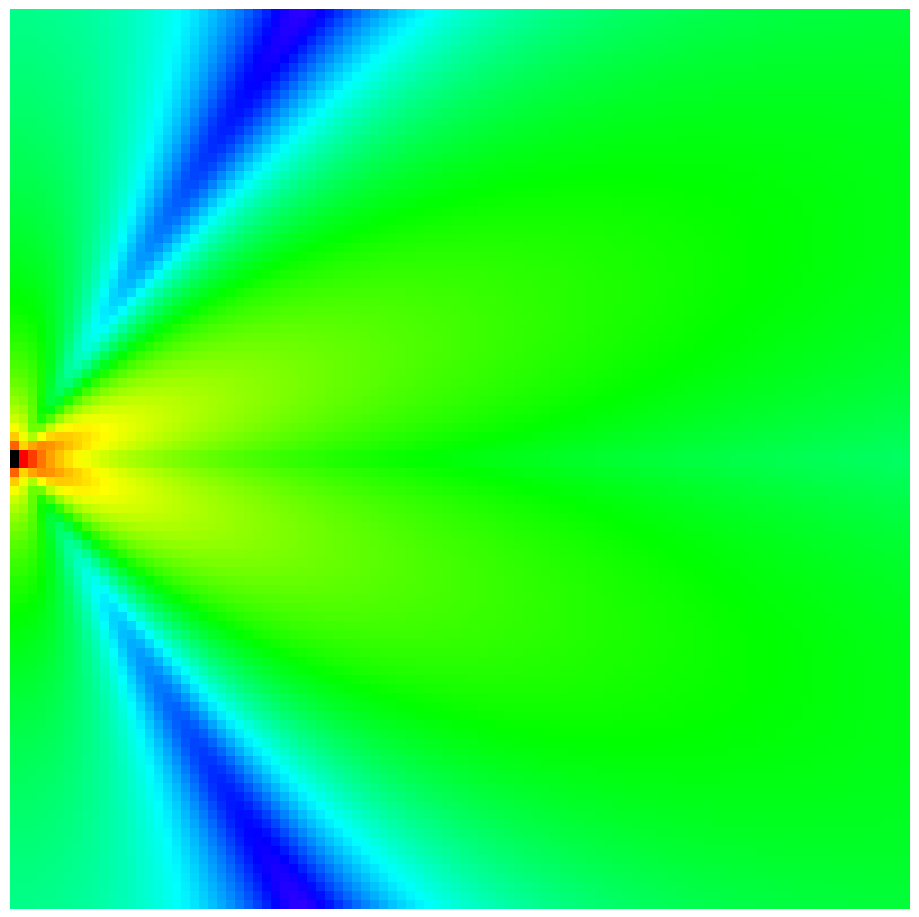
After another day of working mostly on other things, I finally found the problem. I was using the sine function to find an “offset pressure multiplier” for the later-arriving drivers. The problem with that is you get the wrong multiplier. If two drivers arrive perfectly in phase, then the phase offset is 0 radians. The output of sin(0) is 0. Multiply the second driver’s pressure by 0, and…you get 0. Which would mean that two drivers in perfect phase alignment would have one of them not contributing to the pressure. That’s completely incorrect.
What I needed to use was cos(). The value of cos(0) is 1, meaning that a driver perfectly in phase with a reference sums at its full pressure. That’s what we want. NOW, I think this is right.