They’re better than other real time analysis systems.
Please Remember:
The opinions expressed are mine only. These opinions do not necessarily reflect anybody else’s opinions. I do not own, operate, manage, or represent any band, venue, or company that I talk about, unless explicitly noted.

 Want to use this image for something else? Great! Click it for the link to a high-res or resolution-independent version.
I don’t really know how common it is, but there are at least a few of us who like to do a particular thing with our console solo bus:
We connect some sort of analyzer across the output.
This is really handy, because you can look at different audio paths very easily – no patching required. You do what you have to do to enable “solo” on the appropriate channel(s), and BOOM! What you’ve selected, and ONLY what you’ve selected, is getting chewed on by the analyzer.
The measurement solution that seems to be picked the most often is the conventional RTA. You’ve almost certainly encountered one at some point. Software media players all seem to feature at least one “visualization” that plots signal magnitude versus frequency. Pro-audio versions of the RTA have more frequency bands (often 31, to match up with 1/3 octave graphic EQs), and more objectively useful metering. They’re great for finding frequency areas that are really going out of whack while you’re watching the display, but I have to admit that regular spectrum displays have often failed to be truly useful to me.
It’s mostly because of their two-dimensional nature.
I Need More “Ds,” Please
A bog-standard spectrum analyzer is a device for measuring and displaying two dimensions. One dimension is amplitude, and the other is frequency. These dimensions are plotted in terms of each other at quasi-instantaneous points in time. I say “quasi” because, of course, the display does not react instantaneously. The metering may be capable of reacting very quickly, and it may also have an averaging function to smooth out wild jumpiness. Even so, the device is only meant to show you what’s happening at a particular moment. A moment might last a mere 50ms (enough time to “see” a full cycle of 20 Hz wave), or the moment might be a full-second average. In either case, once the moment has passed, it’s lost. You can’t view it anymore, and the analyzer’s reality no longer includes it meaningfully.
This really isn’t a helpful behavior, ironically because it’s exactly what live production is. A live-show is a series of moments that can’t be stopped and replayed. If you get into a trouble spot at a particular time, and then that problem stops manifesting, you can’t cause that exact event to happen again. Yes, you CAN replicate the overall circumstances in an attempt to make the problem manifest itself again, but you can’t return to the previous event. The “arrow of time,” and all that.
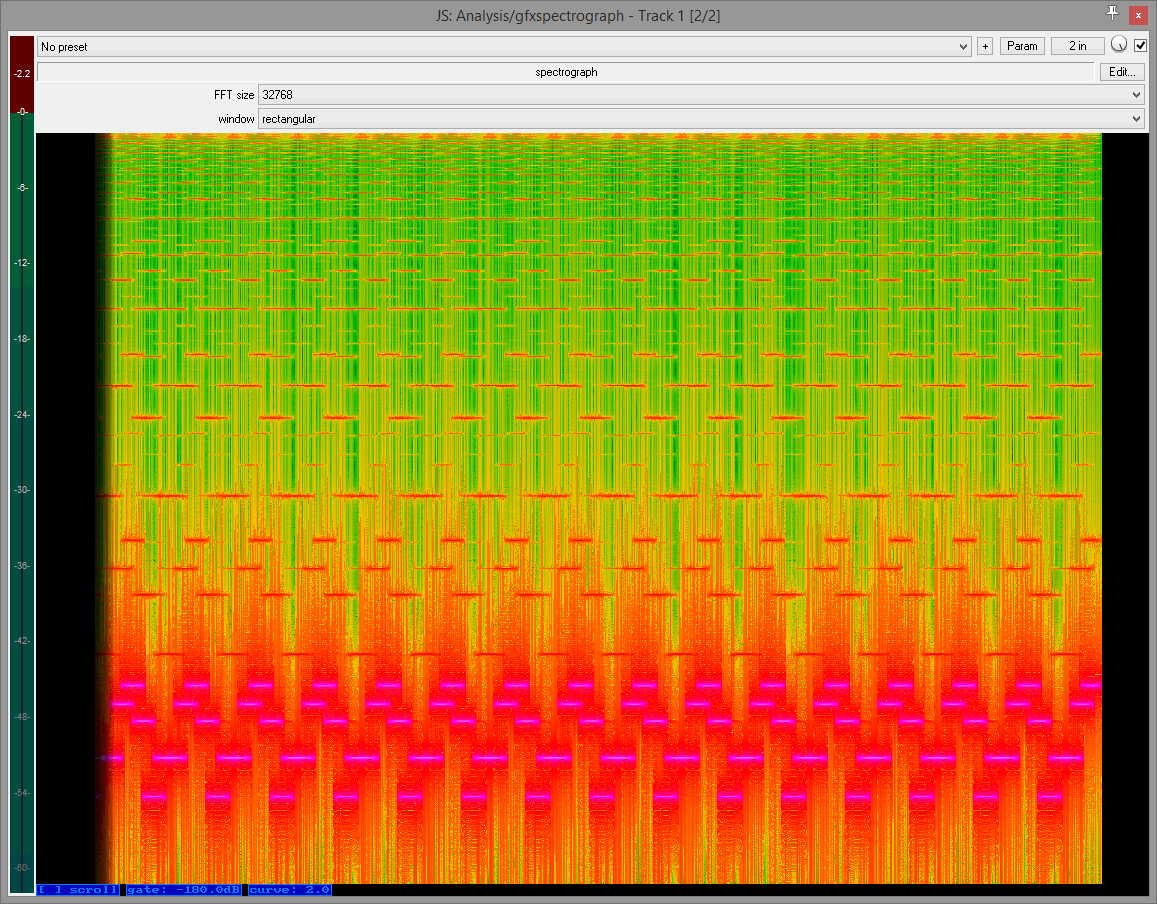
This is where the spectrograph reveals its gloriousness: It’s a three-dimensional device.
You might not believe me, especially if you’re looking at the spectrograph image up there. It doesn’t look 3D. It seems like a flat plot of colors.
A plot of colors.
Colors!
When we think of 3D, we’re used to all of the dimensions being represented spatially. We look for height, width, and depth – or as much depth as we can approximate on displays that don’t actually show it. A spectrograph uses height and width for two dimensions, and displays the third with a color ramp.
The magic of the spectrograph is that it uses the color ramp for the magnitude parameter. This means that height and width can be assigned, in whatever way is most useful, to frequency and TIME.
Time is the key.
Good Timing
With a spectrograph, an event that has been measured is stored and displayed alongside the events that follow it. You can see the sonic imprint of those past events at whatever time you want, as long as the unit hasn’t overwritten that measurement. This is incredibly useful in live-audio, especially as it relates to feedback.
The classic “feedback monster” shows up when a certain frequency’s loop gain (the total gain applied to the signal as it enters a transducer, traverses a signal path, exits another transducer, and re-enters the original transducer) becomes too large. With each pass through the loop, that frequency’s magnitude doesn’t drop as much as is desired, doesn’t drop at all, or even increases. The problem isn’t the frequency in and of itself, and the problem isn’t the frequency’s magnitude in and of itself. The problem is the change in magnitude over time being inappropriate.
There’s that “time” thing again.
On a basic analyzer, a feedback problem only has a chance of being visible if it results in a large enough magnitude that it’s distinguishable from everything else being measured at that moment. At that moment, you can look at the analyzer, make a mental note about which frequency was getting out of hand, and then try to fix it. If the problem disappears because you yanked the fader back, or a guitar player put their hand on their strings, or a mic got temporarily moved to a better spot, all you have to go on is your memory of where the “spike” was. Again, the basic RTA doesn’t show you measurements in terms of time, except within the limitations of its own attack and release rates.
But a spectrograph DOES show you time. Since a feedback problem is a limited range of frequencies that are failing to decay swiftly enough, a spectrograph will show that lack of decay as a distinctive “smear” across the unit’s time axis. If the magnitude of the problem area is large enough, the visual representation is very obvious. Further, the persistence of that representation on the display means that you have some time to freeze the analyzer…at which point you can zero in on exactly where your problem is, so as to kill it with surgical precision. No remembering required.
So, if you’ve got a spectrograph inserted on your solo bus, you can solo up a problem channel, very briefly drive it into feedback, drop the gain, freeze the analyzer, and start fixing things without having to let the system ring for an annoyingly long time. This is a big deal when trying to solve a problem during a show that’s actually running, and it’s also extremely useful when ringing out a monitor rig by yourself. If all this doesn’t make the spectrograph far more glorious than a basic, 2D analyzer, I just don’t know what to do for you.