Category Archives: Sound, Lighting, and Venue Software

Handy applications for venues, techs, and bands, as well as reviews and opinions about those applications.

Details Of A Streaming Setup

A few mics, a few speakers, a few cameras, a mixer, and a laptop.

Backyard Sound SystemWant to use this image for something else? Great! Click it for the link to a high-res or resolution-independent version.

Please Remember:

The opinions expressed are mine only. These opinions do not necessarily reflect anybody else’s opinions. I do not own, operate, manage, or represent any band, venue, or company that I talk about, unless explicitly noted.

A few days ago, I was contacted by Forest Aeon on Patreon. Forest asked me to go into detail about the streaming setup I’ve been using for Carolyn’s Garden concerts during these days of “pandemia.” I was tickled to be asked and happy to oblige. So, first things first. Here’s a diagram:

Streaming Setup Diagram

But what does it all mean?

To start with, streaming requires audio and video inputs. Those inputs are fed to hardware or software that can combine them into a multiplexed audio/ video stream, and then that stream is sent to an endpoint – like Facebook, YouTube, or (in my case) Restream.io

For my purposes, the audio required a good bit of heavy lifting. High production-values were a must, and those standards – while high everywhere – had to meet different needs at multiple destinations. The musicians needed multiple mixes for stage monitors, the small audience present at Carolyn’s needed something they could listen to, the streaming laptop also needed an appropriately processed version of the main mix, and I needed to monitor that feed to the laptop.

With all those needs, a well-appointed mixing console was a must. An X32 was the natural choice, because it has the routing and processing necessary to make it all happen. There were mixes for the individual musicians, a mix for the live audience, and crucially, a mix for the stream that “followed” the main mix but had some independence.

What I mean by that last phrase is driven by signal flow. The stream mix is post-fader, just like the main mix, so if I put more of a channel into the main mix, that channel will also be driven harder in the stream. This makes sense to have in place, because a solo that needs a little push for the live audience should also get a push for the remote audience. At the same time, I allowed a good bit of margin in where those post-fader sends could be placed. The reason for that was to deal with the difference between a stream mix that is far more immune to acoustic contributions in the room than a live mix. In the live mix, a particular instrument might be “hot” in the monitors, and only need a bit of reinforcement in the room. However, that monitor bleed is not nearly as prevalent for the mix to the stream, so that particular channel might need to be “scaled up” to create an appropriate blend for the remote listeners.

Another reason for a separate stream mix was to be able to have radically different processing for the mix as a whole. Just as a starter, the stream mix was often delayed by 100ms or more to better match the timing of the video. If the stream mix was just a split of the main output, that would have meant a very troublesome delay for the audience in the garden. Further, the stream mix was heavily compressed in order for its volume to be consistently high, as that’s what is generally expected by people listening to “playback.” Such compression would have been quite troublesome (and inappropriate, and unnecessary) for the live audience.

The mix for the stream was directed to the console’s option card, which is a USB audio interface. That USB audio was then handed off to the streaming laptop, which had an OBS (Open Broadcast Studio) input set to use the ASIO plugin available for OBS. All other available audio from the laptop was excluded from the broadcast.

Video managed to be both quite easy and a little tricky, just in divergent ways. On the easy side, getting three – very basic – USB cameras from Amazon into a USB hub and recognized by OBS was pretty much a snap. However, the combined video data from all three cameras ended up saturating the USB bus, meaning that I ended up setting the cameras to shut themselves off when not in use. Transitions from camera to camera were less smooth, then, as the camera being transitioned from would abruptly shut off, but I could keep all three cameras available at a moment’s notice.

With OBS I could combine those camera feeds with the mixer audio, plus some text and graphics, and then encode the result into an RTMP stream to Restream.io (As an aside, a very handy feature of OBS is the Scene Collection, which allowed me to have a set of scenes for each act. In my case, this made having a Venmo address for each act much easier, because switching to the appropriate collection brought up the correct text object.)

A very big thing for me was the manner in which the laptop was connected to the public Internet. I was insistent on using a physical patch cable, because I simply don’t trust Wi-fi to be reliable enough for high-value streaming. That’s not to say I would turn down wireless networking in a pinch, but I would never have it as my first option. Luckily, Cat6 patch cable is pretty darn cheap, being available for about $0.25 per foot. A 100′ cable, then, is all of $25. That’s awfully affordable for peace of mind, and drives home the point that it takes very expensive wireless to be as good as a basic piece of wire.

So, there you have it: My streaming setup for summer concerts.

Acoustic Calculator Update

It has been markedly improved.

Please Remember:

The opinions expressed are mine only. These opinions do not necessarily reflect anybody else’s opinions. I do not own, operate, manage, or represent any band, venue, or company that I talk about, unless explicitly noted.

 
Want to use this image for something else? Great! Click it for the link to a high-res or resolution-independent version.

Along with some under-the-hood improvements to display and general behavior, you can now hide the controls if you like…and add delays to drivers!

The calculator is available here.

A Very Simple Acoustic Calculator/ Simulator

A little toy for visualizing driver interactions.

Please Remember:

The opinions expressed are mine only. These opinions do not necessarily reflect anybody else’s opinions. I do not own, operate, manage, or represent any band, venue, or company that I talk about, unless explicitly noted.

 
Want to use this image for something else? Great! Click it for the link to a high-res or resolution-independent version.

I recently wrote up a piece about my adventures and/ or misadventures in creating an acoustic calculator. I’ve since deployed that calculator. You can play with it here.

The calculator requires that you first specify a frequency of interest before generating the acoustical workspace, but you can change that frequency at any time after specifying it – even with drivers already placed. The calculator assumes that all drivers are omnidirectional.

But how does it work?

the.u.forIn(the.drivers, function(index, driver) {
   let x = Math.abs(driver.x - column);
   let y = Math.abs(driver.y - row);
   x = x**2;
   y = y**2;
   const initialPressure = 1;
   cell.value.distancesToDrivers[index] = Math.sqrt(x+y);
   let distanceDoubles = Math.log2(cell.value.distancesToDrivers[index]);
   cell.value.driverPressures[index] = initialPressure / (2**distanceDoubles);
});


First, the calculator traverses each grid cell and determines the distance from that cell to each driver. Since we’re working on a grid, the difference between the cell’s horizontal and vertical location vs. the driver’s horizontal and vertical location can be treated as two legs of a right triangle. When you do that, the Pythagorean Theorem will spit out the length of the hypotenuse as neatly as you please.

From there, we can determine the apparent pressure of the drivers at the observation point. The initial assumption is that, at a distance of 1, the observed pressure is 1 (1 Pascal, to be exact). This makes the “decay” calculation simpler. It allows us to simply find the number of times the distance has doubled from 1 – in other words, the base 2 logarithm of the distance. For example, at a distance of 8, the distance to the driver has doubled three times from a distance of 1. (2^3 = 8)

Also for the sake of simplicity, the assumption is that we’re in a completely free field with no reflections of any kind. This means that we expect to lose 6dB with every doubling of distance. A 6dB loss is 1/2 the apparent pressure, so for each doubling of distance we divide by two again. A compact way of doing this in our particular case is to divide the initial pressure of 1 by 2, raised to the power of the number of distance doublings we found. Again, using a distance of 8, we would get 1/2^3, or 1/8.

The next thing to do is to find the driver which arrives first at each observation point. That driver is the reference for all other drivers in terms of phase. After that…

the.u.forIn(the.drivers, function(index, driver) {

   if (index !== shortestArrival.driver) {
     let arrivalOffset = Math.abs(cell.value.distancesToDrivers[index] -  cell.value.distancesToDrivers[shortestArrival.driver]);
     const totalCycles = arrivalOffset / wavelength;
     const phaseRadians = totalCycles*(2*Math.PI);
     cell.value.driverPhaseRadians[index] = phaseRadians;
     //Use cos(), because a 0 radian offset should result in a multiplier of 1.
     //(The wave is in phase, so its full pressure sums with the reference.)

      const phasePressure = Math.cos(phaseRadians) * cell.value.driverPressures[index];
     cell.value.finalSummedPressure = phasePressure + cell.value.finalSummedPressure;
     cell.value.finalSummedPressure = Math.abs(cell.value.finalSummedPressure);

  }
});

Next, we go through all the other drivers and figure out the difference in phase angle between them and the reference. Doing this requires knowing the wavelength, so that the difference in arrival distance divided by wavelength gives the total difference in cycles. We can then find the phase angle in radians by multiplying the difference in cycles by 2pi radians.

Having found the phase angle in radians, feeding that to cos() gets us a multiplier for the observed pressure of that driver at the observation point. With cos(), a phase angle of 0 radians means a multiplier of 1 – and that makes sense, because two waves in phase will fully add their pressures. A phase angle of pi radians would get us a multiplier of -1, meaning that the two waves would cancel out at the observation point.

Having found the multiplier, we add the driver pressure multiplied by that number to the total pressure at the spot in the grid we’re measuring. The process is repeated for each driver.

When that’s all done, we convert the final pressure to an SPL, which can be assigned a color.

When those colors are plotted, we have our acoustical calculation/ simulation to look at on the grid.

Calculated Adventures

Danny tries to create an acoustical prediction system.

Please Remember:

The opinions expressed are mine only. These opinions do not necessarily reflect anybody else’s opinions. I do not own, operate, manage, or represent any band, venue, or company that I talk about, unless explicitly noted.

 
Want to use this image for something else? Great! Click it for the link to a high-res or resolution-independent version.

(Important Note: After publishing, I finally realized that something was very wrong with my calculations. I put in a fix, and have documented it at the end of this article.)

The thing is, I really want to write about what happens when you build a line of drivers – how they interact acoustically. The problem is that my favorite, relatively easy to use acoustical prediction software was taken and made into an iOS-only app by somebody. (I am disappointed in that somebody. Maybe even angry.) Everything else that’s out there is overly complex for what I need to do.

Being a little nutty, I thought to myself: “Couldn’t you make something yourself that does what you need?”

Which is hilarious, because in the time it would take me to build my own calculator, I could probably figure out how to use one of the overly complex calculators in a minimal way. But whatever! I need to learn React to be a modern UI developer anyway, and this will help me on that road.

The first step in modeling a problem is figuring out how to represent it.

After some thinking, I determined that the first thing I needed was a way to input the frequency of interest, and how many drivers would be involved. That’s easy enough.

In acoustic calculation, what we’re trying to do is determine how much pressure we have at a given point in space. With any computer display, visually plotting that information involves a grid. To get started, I don’t need ultra-high resolution. A 100×100 array of boxes should do the trick, right?

That’s what I thought, until I saw it rendered in reality. Zoinks! A 40×40 grid is much better, and seems perfectly adequate if 20Hz waves aren’t really important to us. (A 20Hz wave is about 50ft long, and I’m going to be assuming that each grid box is about a foot square.)

After a good bit of futzing with React and CSS styling, I can see the grid.

Now, I have to plot speaker positions. A really full-featured calculator would allow for arbitrary locations – but I’m in a hurry, so I’ll just place the speakers programmatically. I’m going to see if I can build a line along the left side of the grid, essentially centered vertically.

After a lot of bumbling around with offsets and a misuse of the addition operator, I finally get things to position themselves appropriately.

Of course, I wouldn’t be me if I didn’t change my mind. After getting the speakers to plot correctly, I decided that a higher-res grid was better, and also that I didn’t want gridlines. This was after I finished my code for abstract calculations and color plotting. Here’s what I got when plotting one speaker:

That looks about right to me. Plotting two speakers, though, seems wrong. The plot should be symmetrical, and it isn’t quite, plus the “cyclical waves” of intensity are just not how things work in real life. I think I’m going about my calculation incorrectly.

My debugging process was one of looking at my various interstitial values, and trying to figure out where they were different when they should have been the same. In the end, I made one very important determination: When calculating the phase difference and resulting pressure summation from driver to driver, the reference driver should always be the nearest one to the observation point. If you always start with, say, the first driver, the graph will bias off towards that sound source. Here’s my stab at an explanation for why:

Humans don’t experience a show from all points in space simultaneously, and omnisciently about a particular sound source being “first.” Instead, we experience the show from where we are, and whatever source of sound is the closest to us is the “0 phase” reference point.

What I’ve got now is much better. It still seems to have some issues, but my sneaky suspicion is that grid resolution and floating point math may be the final hindrance on the way to perfection.

Wait…no, that’s not right at all. Those two drivers should sum very handily in the middle. What’s going on?

After another day of working mostly on other things, I finally found the problem. I was using the sine function to find an “offset pressure multiplier” for the later-arriving drivers. The problem with that is you get the wrong multiplier. If two drivers arrive perfectly in phase, then the phase offset is 0 radians. The output of sin(0) is 0. Multiply the second driver’s pressure by 0, and…you get 0. Which would mean that two drivers in perfect phase alignment would have one of them not contributing to the pressure. That’s completely incorrect.

What I needed to use was cos(). The value of cos(0) is 1, meaning that a driver perfectly in phase with a reference sums at its full pressure. That’s what we want. NOW, I think this is right.

A Survey Of My Measurement Tools And Techniques

From ears to computers and back again.

Please Remember:

The opinions expressed are mine only. These opinions do not necessarily reflect anybody else’s opinions. I do not own, operate, manage, or represent any band, venue, or company that I talk about, unless explicitly noted.

 
Want to use this image for something else? Great! Click it for the link to a high-res or resolution-independent version.

I was recently asked specifically to write about how I measure and tune audio systems. I was tickled; Having topics suggested to me is something I dearly love. Here you go, then…an article about how I figure out what’s going on with a PA system, and the tools involved.

I’m going to set this against a “background” of a composite case study: Deploying a monitor system, FOH PA, and delays for the IAMA Bluegrass Night at Gallivan Plaza. I’ve done two iterations of the full setup now, handled slightly different ways, and have had success at it both times. Yes, I’m aware of the irony that Gallivan Plaza is definitely not a small venue. I may need to change the name of this site at some point. Well, anyway…

I Start With My Ears

When everything is placed, powered, and attached to signal, it’s time to get out a pink noise generator and do some listening. I’m fortunate in that my preferred consoles (Behringer/ Midas X/M 32s of various configurations) have noise generators built in. The point of this step is twofold.

  1. Confirm that everything is working and getting signal.
  2. Find out if anything is glaringly, obviously out of spec or set incorrectly.

If everything is passing noise, the polarity of the subwoofers seems right at one setting or another, and all boxes of the same model sound essentially the same, it’s time to move on. I don’t spend a lot of time on this step. There is no “agonizing” here. If something is clearly broken, mispatched, level-trimmed incorrectly, or significantly different in transfer-function than it ought to be, I act on it. If it doesn’t grab my attention immediately, it’s fine.

I want to note right here that many of the middle steps I’m about to discuss are often skipped. The Gallivan show is one where I have the time, support, and necessity to do more intensive measurement. On many other shows, instrument-aided analysis doesn’t make it onto the priorities list. That might seem a shame, and it might be to some extent, but it also highlights just how much mileage you get out of strong basics. Especially now, in the days of ultra-engineered loudspeakers, a simple check for correct function and level goes a long way.

Two Methods For System-To-System Time Alignment

I generally don’t worry about bandpass-level time alignments, especially when they involve boxes that are offset to the left or right of each other. For example, getting the full-range FOH speakers to line up exactly with the center-clustered subwoofers at some chosen point is more work than it’s worth in my case. Alignment that’s (effectively) along the horizontal axis is a situation where correction at one point is likely to be hugely UN-correct at many other points.

Delays are a different story. Alignment of whole, full range systems along the depth axis is much more effective. When you’re correcting for a distance that’s largely described by walking away from the main system, on axis, your chosen solution will be much more stable – that is, relevant and correct – for more audience members. (It still won’t be perfect, though, but that’s life.)

Because I don’t have a dual-FFT measurement system with a delay finder, I have two methods for measuring propagation time.

Two Mics And A DAW

The first method is to set a microphone right up against a main PA loudspeaker. Then, another microphone is set at the point that the solution is going to be tuned to. I recommend moving the second point off the delay speaker’s location horizontally, so that you’re midway between center stage and the audience’s outside edge. This is because, statistically, more people will be close to that horizontal location than dead center or to the far outside.

You then record both microphones into an audio workstation, like Reaper, on separate channels. While the recording is running, you play a single click or other, similar sound through the main speaker you’re using for reference. You do NOT play the click through the delay. Remember: You want to find the time that it takes that single click from the main to arrive. The click has to be loud enough at the delay point to be clearly distinguishable from ambient noise, so keep that in mind when setting levels.

At some time, the impulse will arrive at the first microphone. At time+delay, that same click will arrive at the solution-point microphone. If you get into your recording and measure the time between the click arrivals, you get your delay setting.

Those Two Funny Things On The Side Of Your Head

This method is significantly less accurate than a two-mic measurement, but it can be okay in a pinch. Remote control of your system is very helpful when trying this.

For the measurement, set the delay speaker to have an apparent level that’s very similar to the level of the main PA at the solution point. Now, stand at your desired solution point, and play a click through BOTH the main PA and delay speaker. (Use only one “side” of the PA if you can.) It will probably help to plug one ear, or at least turn so that one ear is pointed toward the overall sound system. You should clearly hear multiple arrivals. Adjust the delay time to the delay speaker slowly, listening for when the two arrivals seem to merge into one. Now, play some music or noise through both the main PA and the delays, listening for comb-filtering effects at your solution point. Adjust the delay until you get the least-objectionable result possible. Finally, restore the delay speaker to full level.

*****

Sidenote: My current methodology with delays is for them to be significantly louder than the main system when you’re standing close to them, so as to mitigate comb-filtering problems. If the signal that’s misaligned is relatively low in level, like 15 dB down or an even lesser magnitude, its summation effects are greatly reduced.

Meddling In The Affairs Of Wizards (Possibly With An Omnimic)

As I mentioned before, I don’t have a dual-FFT measurement system available. This doesn’t bother me very much; I’ve come to prefer single-ended measurement tools. They do have limitations, in that they require a known measurement stimulus signal to operate and thus aren’t good for “real time” readings, but they can still tell you a great deal about your system’s initial state. They’re also less fiddly in certain ways, like not being affected by propagation delay to the measurement mic.

I’ve used both the Dayton Omnimic system and Room EQ Wizard, and I’ve come to like REW’s more contemplative, “measure, tweak, measure again” workflow over Dayton’s “measure and tweak while annoying signals are running and the magnitude graph is bouncing around.”

The specifics of each system are beyond the scope of this article, but I will make some generalizations:

  1. Make sure your measurement signal is loud enough to swamp ambient noise, but not so loud that everyone around hates you. Sine sweeps have better signal-to-noise performance overall, because at any given instant the signal is a single frequency at a certain SPL, rather than all audio frequencies forming a total SPL.
  2. A basically okay measurement mic is just fine. I have a Behringer that I got for something like $50, and it’s survived occasional bouts of nonsense (like gravity plus a hard floor) while still delivering results that I can use meaningfully.
  3. Put the mic where your head is going to go.
  4. I generally don’t average a bunch of measurements. Mostly, I try to pick a point that represents my average audience member decently, and capture that for tuning. It’s important, though, to keep in mind that your tuning will deflect at physical points that aren’t where your mic was.
  5. Smooth your traces so that you can read them, but not so much that they lie like the people who were trying to sell me beachfront property in Topeka. I recommend 6dB per octave smoothing to start.
  6. Don’t chase every peak and dip. Look for trends and major deviations.
  7. Try to find a “hinge frequency” that represents the center of overall magnitude, such that overall boosts and overall cuts balance out. Be especially resistant to boosts that seem very large relative to any cuts you might make.
  8. Go for flat response in a reasonable passband for the boxes and application. Don’t boost anything to your subwoofers below about 45 Hz, or even better, don’t boost anything. If you find an egregious sub peak, cut it and leave everything else alone. A regular ol’ monitor wedge can often start rolling off around 75 Hz without anybody being upset about it.
  9. Measure after you tune whenever possible. If something in the trace doesn’t seem to be responding, that’s almost certainly to do with acoustics or time, and your EQ alone will not fix it. If a tweak doesn’t produce a meaningful response, free up that EQ band.

I End With My Ears

The final analysis goes right back to my hearing. This is also why tablet-driven mixing is so helpful. I can walk out to a monitor, or the main PA, or the delay system, and hear it while I make my last few decisions. Does my tuning make any sense in real life? Do the mains kill me when I’m up close? These are questions that are answered by listening. Also, for every practical purpose I’ve stopped doing any real tuning with music. I do use music for a basic reference point on listenability, but what I really want to know is how a vocal mic sounds through the boxes. If a vocal mic sounds terrible in FOH or monitor world…surprise! It sounds terrible, and no amount of “the trace looked right” can defend that. Be concerned about your reinforcement inputs, not your break music.

The Network Around The Corner

We might be moving towards an abstract future.

Please Remember:

The opinions expressed are mine only. These opinions do not necessarily reflect anybody else’s opinions. I do not own, operate, manage, or represent any band, venue, or company that I talk about, unless explicitly noted.

 
Want to use this image for something else? Great! Click it for the link to a high-res or resolution-independent version.

I once wrote an article on this site about how I don’t feel like I can predict the future of live audio. I still don’t think I can predict it. Even so, I may have had a flash of inspiration lately, stemming from a conversation I had some months ago.

We were setting up for the Samba Fogo show run, and Jeff, the lighting designer and operator, reacted to something I said.

“Look at where digital consoles are now, relative to the start of your career. Lots of things are going to change.”

Well now – that got the juices flowing, even though I wasn’t consciously aware of it.

Those juices were working their way through my system a few days ago, when suddenly it hit me:

What it we’re moving toward a future where everything is networked and essentially abstract? Consoles and system management devices use networked audio right now. More speakers (some already do this) would have network ports to handle audio and remote management.

The only thing missing is the input side.

Microphones and DI boxes themselves could house a sub-miniature preamp and network interface, connecting via cables with Ethercon ends. Power-over-ethernet is already a real and mature technology, so the problem of needing bias voltage is essentially solved.

We might encounter a world, not too far distant, where the channel number is essentially obsolete. Sure, the input devices would tag what port they’re connected to, so that multiples of the same model could be sorted out. In the end, though, a device connects to the network, IDs itself, locks to the network clock, and then you just put it on your console’s input list. Because it’s all abstract, the patching order ceases to matter. You just drag and drop whatever channel you want into any position you want. It would no longer be a case of “Vocal 2 is on input 10 which is patched to channel 4.” The situation would be “The vocal 2 channel is currently at this place on the screen.”

It’s similar with output patching. You could just say something like, “Main LR to Yamaha DZR 1/2,” and that would be the end of it.

This doesn’t solve every problem, of course, and it has complexities that are all its own, but I see it as perfectly viable and a way that things might go.


Ask Me Something For Thursday

I’ll be doing a live show with AMR.FM on July 9th.

Please Remember:

The opinions expressed are mine only. These opinions do not necessarily reflect anybody else’s opinions. I do not own, operate, manage, or represent any band, venue, or company that I talk about, unless explicitly noted.

askanythingwebWant to use this image for something else? Great! Click it for the link to a high-res or resolution-independent version.

Just a reminder: On July 9th, I’ll be live on AMR.FM. If you’ve got a question about live production that you want answered, now’s the time to ask!

If you’ve subscribed to this site’s feed via email, you can email a question (or multiple questions) to me. You can also get in contact with me via Facebook or Twitter. Obviously, I can’t guarantee that any particular question will be answered, but I’ll do my best to get things in.

To listen to the show, you’ll have to go to AMR.FM and select “United States” & “Utah” in the appropriate dropdowns. The plan is to be on at 7:00 PM, Mountain Daylight Time.


How Much Output Should I Expect?

A calculator for figuring out how much SPL a reasonably-powered rig can develop.

Please Remember:

The opinions expressed are mine only. These opinions do not necessarily reflect anybody else’s opinions. I do not own, operate, manage, or represent any band, venue, or company that I talk about, unless explicitly noted.

howloudWant to use this image for something else? Great! Click it for the link to a high-res or resolution-independent version.

As a follow-on to my article about buying amplifiers, I thought it would be helpful to supply an extra tool. The purpose of this calculator is to give you an idea of the SPL delivered by a “sanely” powered audio rig.

A common mistake made when estimating output is to assume that the continuous power the amp is rated for will be easily applied to a loudspeaker. This leads to inflated estimations of PA performance, because, in reality, actually applying the rated continuous power of the amp is relatively difficult. It’s possible with a signal of narrow bandwidth and narrow dynamic range – like feedback, or sine-wave synth sounds, but most music doesn’t behave that way. Most of the time, the signal peaks are far above the continuous level…

…and, to be brutally honest, continuous output is what really counts.


This Calculator Requires Javascript

This calculator is an “aid” only. You should not rely upon it solely, especially if you are using it to help make decisions that have legal implications or involve large amounts of money. (I’ve checked it for glaring errors, but other bugs may remain.) The calculator assumes that you have the knowledge necessary to connect loudspeakers to amplifiers in such a way that the recommended power is applied.


Enter the sensitivity (SPL @ 1 watt @ 1 meter) of the loudspeakers you wish to use:

Enter the peak power rating of your speakers, if you want slightly higher performance at the expense of some safety. If you prefer greater safety, enter half the peak rating:

Enter the number of loudspeakers you intend to use:

Enter the distance from the loudspeakers to where you will be listening. Indicate whether the measurement is in feet or meters. (Measurements working out to be less than 1 meter will be clamped to 1 meter.)

Click the button to process the above information:

Recommended amplifier continuous power rating at loudspeaker impedance:
0 Watts

Calculated actual continuous power easily deliverable to each loudspeaker:
0 Watts

Calculated maximum continuous output for one loudspeaker at 1 meter:
0 dB SPL

Calculated maximum continuous output for one loudspeaker at the given listening position:
0 dB SPL

Calculated maximum continous output for entire system at the given listening position:
0 dB SPL

How The Calculator Works

First, if you want to examine the calculator’s code, you can get it here: Maxoutput.js

This calculator is intentionally designed to give a “lowball” estimate of your total output.

First, the calculator divides your given amplifier rating in half, operating on the assumption that an amp rated with sine-wave input will have a continuous power of roughly half its peak capability. An amp driven into distortion or limiting will have a higher continuous output capability, although the peak output will remain fixed.

The calculator then assumes that it will only be easy for you to drive the amp to a continuous output of -12 dB referenced to the peak output. Driving the amp into distortion or limiting, or driving the amp with heavily compressed material can cause the achievable continuous output to rise.

The calculator takes the above two assumptions and figures the continuous acoustic output of one loudspeaker with a continuous input of -12 dB referenced to the peak wattage available.

The next step is to figure the apparent level drop due to distance. The calculator uses the “worst case scenario” of inverse square, or 6 dB of SPL lost for every doubling of distance. This essentially presumes that the system is being run in an anechoic environment, where sound pressure waves traveling away from the listener are lost forever. This is rarely true, especially indoors, but it’s better to return a more conservative answer than an “overhyped” number.

The final bit is to sum the SPLs of all the loudspeakers specified to be in the system. This is tricky, because the exact deployment of the rig has a large effect – and the calculator can’t know what you’re going to do. The assumption is that all the loudspeakers are audible to the listener, but that half of them appear to be half as loud.


Noise Notions

When measuring things, pink noise isn’t the only option.

Please Remember:

The opinions expressed are mine only. These opinions do not necessarily reflect anybody else’s opinions. I do not own, operate, manage, or represent any band, venue, or company that I talk about, unless explicitly noted.

Want to fftanalyzeruse this image for something else? Great! Click it for the link to a high-res or resolution-independent version.

Back in school, we learned how to measure the frequency response of live-audio rigs using a dual FFT system. I didn’t realize at the time how important the idea of measuring would become to me. As a disliker of audio mythology, I find myself having less and less patience for statements like “I swear, it sounds better when we change to this super-spendy cable over here.”

Does it? Are you sure? Did you measure anything? If you can hear it, you should be able to measure it. Make any statement you want, but at least try to back it up with real data.

Anyway.

I’m by no means an expert on all aspects of measuring sound equipment. At the same time, I’ve gotten to the point where I think I can pass on some observations. The point of this article is to have a bit of a chat regarding some signals that can be used to measure audio gear.

Tones and Noise

When trying to measure sound equipment, we almost always need some kind of “stimulus” signal. The stimulus chosen depends on what we’re trying to figure out. If we want to get our bearings regarding a device’s distortion characteristics, a pure tone (or succession of pure tones) is handy. If we want to know about our gear’s total frequency response, we either need a signal that’s “broadband” at any given point in time, or a succession of signals that can be integrated into a broadband measurement over several points in time.

(Pink noise is an example of a signal that’s broadband at any given time point, whereas a tone sweep has to be integrated over time.)

In any case, the critical characteristic that these stimuli share is this:

A generally-useful measurement stimulus is a signal whose key aspects are well defined and known in advance of the test.

With pure tones, for instance, we know the frequency and voltage-level of the tone being generated. With pink noise, we know that all audio frequencies are present and that the overall signal has equal power per octave. (The level of any particular frequency at any particular point in time is not known in advance, unless a specific sample of noise is used repeatedly.)

Pretty In Pink

Pink noise is a very handy stimulus, especially with the prevalence of measurement systems that show us the transfer function of a device undergoing testing.

When folks are talking about “Dual FFT” measurement, this is what they’re referring to. The idea is to compare a known signal arriving at a device’s input with an unknown signal at the device’s output. In a certain sense, the unknown signal is only “quasi” unknown, because the assumption in play is that the observed output IS the input…plus whatever the measured device did to it.

Pink noise is good for this kind of testing because it can easily be continuous – which allows for testing across an indefinite time span – and also because it is known in advance to contain audio across the entire audible spectrum at all times. (As an added bonus, pink noise is much less annoying to listen to than white noise.) It’s true that with a system that computes transfer functions, you can certainly use something like music playback for a stimulus. Heck, you can even use a live show as the test signal. The system’s measurements are concerned with how the output relates to the input, not the input by itself. The bugaboo, though, is that a stimulus with content covering only part of the audible spectrum can’t give you information about what the system is doing beyond that input signal’s bandwidth. Because pink noise covers the entire audible spectrum (and more) all the time, using it as a stimulus means that you can reliably examine the performance of the system-under-test across the entire measurable range.

Now, this is not to say that pink noise is entirely predictable. Because it is a random or pseudo-random signal, a specific frequency’s level at a specific point in time is unknown until the noise is generated. For example, here’s a spectrogram of pink noise that has been aggressively bandpassed at 1kHz:

filteredpinknoise

The tone at 1kHz never completely disappears, but it’s clearly not at the same level all the time.

A major consequence of this variability is that getting a really usable measurement functionally REQUIRES two measurement points. Since the signal is not entirely known in advance, the reference signal MUST be captured during the measurement process. Although some test rigs can smooth un-referenced pink noise, and display the spectrum as being nominally “flat” (as opposed to sloping downwards from low to high frequencies), the resulting measurements just aren’t as good as they could be. It’s just harder than necessary to do something meaningful with something like this:

pinkonlyoneside

Further, any delay caused by the system being measured must be compensated for. If the delay is un-compensated, the measurement validity drops. Even if the frequency response of the measured system is laser-flat, and even if the system has perfect phase response across all relevant frequencies, un-compensated delay will cause this to NOT be reflected in the data. If the dual FFT rig compares an output signal at time “t+delay” to an input signal at “t,” the noise variability means that you’re not actually examining comparable events. (The input signal has moved on from where the output signal is.)

Here’s a simulation of what would happen if you measured a system with 50ms of delay between the input and output…and neglected to compensate for that delay. This kind of delay can easily happen if you’re examining a system via a measurement mic at the FOH mix position, for example.

uncompensateddelay

On the flipside, get everything in order and pink noise reliably gets usable measurements across a variety of test rigs, like these views of a notch filter at 1 kHz.

1kVA

1kSysTune

Hey, I Know That Guy…Er, Noise

I’ve known about pink noise for a long while now. What I didn’t know about until recently was a broadband stimulus that Reaper calls “FFT Noise.”

FFT noise is very interesting to me because it is unlike pink noise in key ways. It is dis-contiguous, in that it consists of a repeating “pulse” or “click.” It is also entirely predictable. As far as I can tell, each pulse contains most of the audible spectrum (31 Hz and above) at an unchanging level. For example, here’s a spectrogram of FFT noise with a narrow bandpass filter applied at 1 kHz:

filteredfftnoise

What’s even more interesting is what happens when the test stimulus is configured to “play nicely” with an FFT-based analyzer. You got a preview of that in the preview above. When the analyzer’s FFT size and windowing are set correctly, a trace that handily beats out some dual FFT measurements (in terms of stability and readability) results:

eqtransfer

Side note: Yup – the calculated transfer function in ReaEQ seems to be accurate.

The point here is that, if the test stimulus is precisely known in advance, then you can theoretically get a transfer function without having to record the input-side in real time. If everything is set up correctly, the “known” signal is effectively predetermined in near totality. The need to sample it to “know it” is removed. Unlike pink noise, this stimulus is exactly the same every time. What’s also very intriguing is that this removes the delay of the device-under-test as a major factor. The arrival time of the test signal is almost a non-issue. Although it does appear advantageous to have an analyzer which uses all the same internal timing references as the noise generator (the trace will be rock steady under those conditions), a compatible analysis tool receiving the signal after an unknown delay still delivers a highly readable result:

laptoptrace

Yes, the cumulative effect of the output from my main computer’s audio interface and the input of my laptop interface is noise, along with some tones that I suppose are some kind of EM interference. You can also see the effect of what I assume is the anti-aliasing filter way over on the right side. (This trace is what gave me the sneaky suspicion that an insufficient amount of test signal exists somewhere below 100 Hz – either that, or the system noise in the bottom octaves is very high.)

On the surface, this seems rather brilliant, even in the face of its limitations. Instead of having to rig up two measurement points and do delay compensation, you can just do a “one step” measurement. However, getting the stimulus and “any old” analysis tool to be happy with each other is not necessarily automatic. “FFT Noise” in Reaper seems to be very much suited to Reaper’s analysis tools, but it takes a little doing to get, say, Visual Analyzer set up well. When a good configuration IS arrived at, however, Visual Analyzer delivers a very steady trace that basically confirms what I saw in Reaper.

fftnoiseva

It’s also possible to get a basically usable trace in SysTune, although the demo’s inability to set a long enough average size makes the trace jumpy. Also, Reaper’s FFT noise plugin doesn’t allow for an FFT size that matches the SysTune demo’s FFT size, so some aggressive smoothing is required.

(As a side note, I did find a way to hack Reaper’s FFT noise plugin to get an FFT size of 65536. This fixed the need for smoothing in the frequency domain, but I wasn’t really sure that the net effect of “one big trace bounce every second” was any better than having lots of smaller bounces.)

There’s another issue to discuss as well. With this kind of “single ended” test, noise that would be ignored by a dual FFT rig is a real issue. In a way that’s similar to a differential amplifier in a mic pre, anything that’s common to both measurement points is “rejected” by a system that calculates transfer functions from those points. If the same stimulus+noise signal is present on both channels, then the transfer function is flat. A single-ended measurement can’t deliver the same result, except by completely drowning the noise in the stimulus signal. Whether this is always practical or not is another matter – it wasn’t practical for me while I was getting these screenshots.

The rabbit-hole goes awfully deep, doesn’t it?


Not Remotely Successful

Just getting remote access to a mix rig is not a guarantee of being able to do anything useful with that remote access.

Please Remember:

The opinions expressed are mine only. These opinions do not necessarily reflect anybody else’s opinions. I do not own, operate, manage, or represent any band, venue, or company that I talk about, unless explicitly noted.

sorrytabletsWant to use this image for something else? Great! Click it for the link to a high-res or resolution-independent version.

The nature of experimentation is that your trial may not get you the expected results. Just ask the rocket scientists of the mid-twentieth century. Quite a few of their flying machines didn’t fly. Some of them had parts that flew – but only because some other part exploded.

This last week, I attempted to implement a remote-control system for the mixing console at my regular gig. I didn’t get the results I wanted, but I learned a fair bit. In a sense, I think I can say that what I learned is more valuable than actually achieving success. It’s not that I wouldn’t have preferred to succeed, but the reality is that things were working just fine without any remote control being available. It would have been a nice bit of “gravy,” but it’s not like an ability to stride up to the stage and tune monitors from the deck is “mission critical.”

The Background

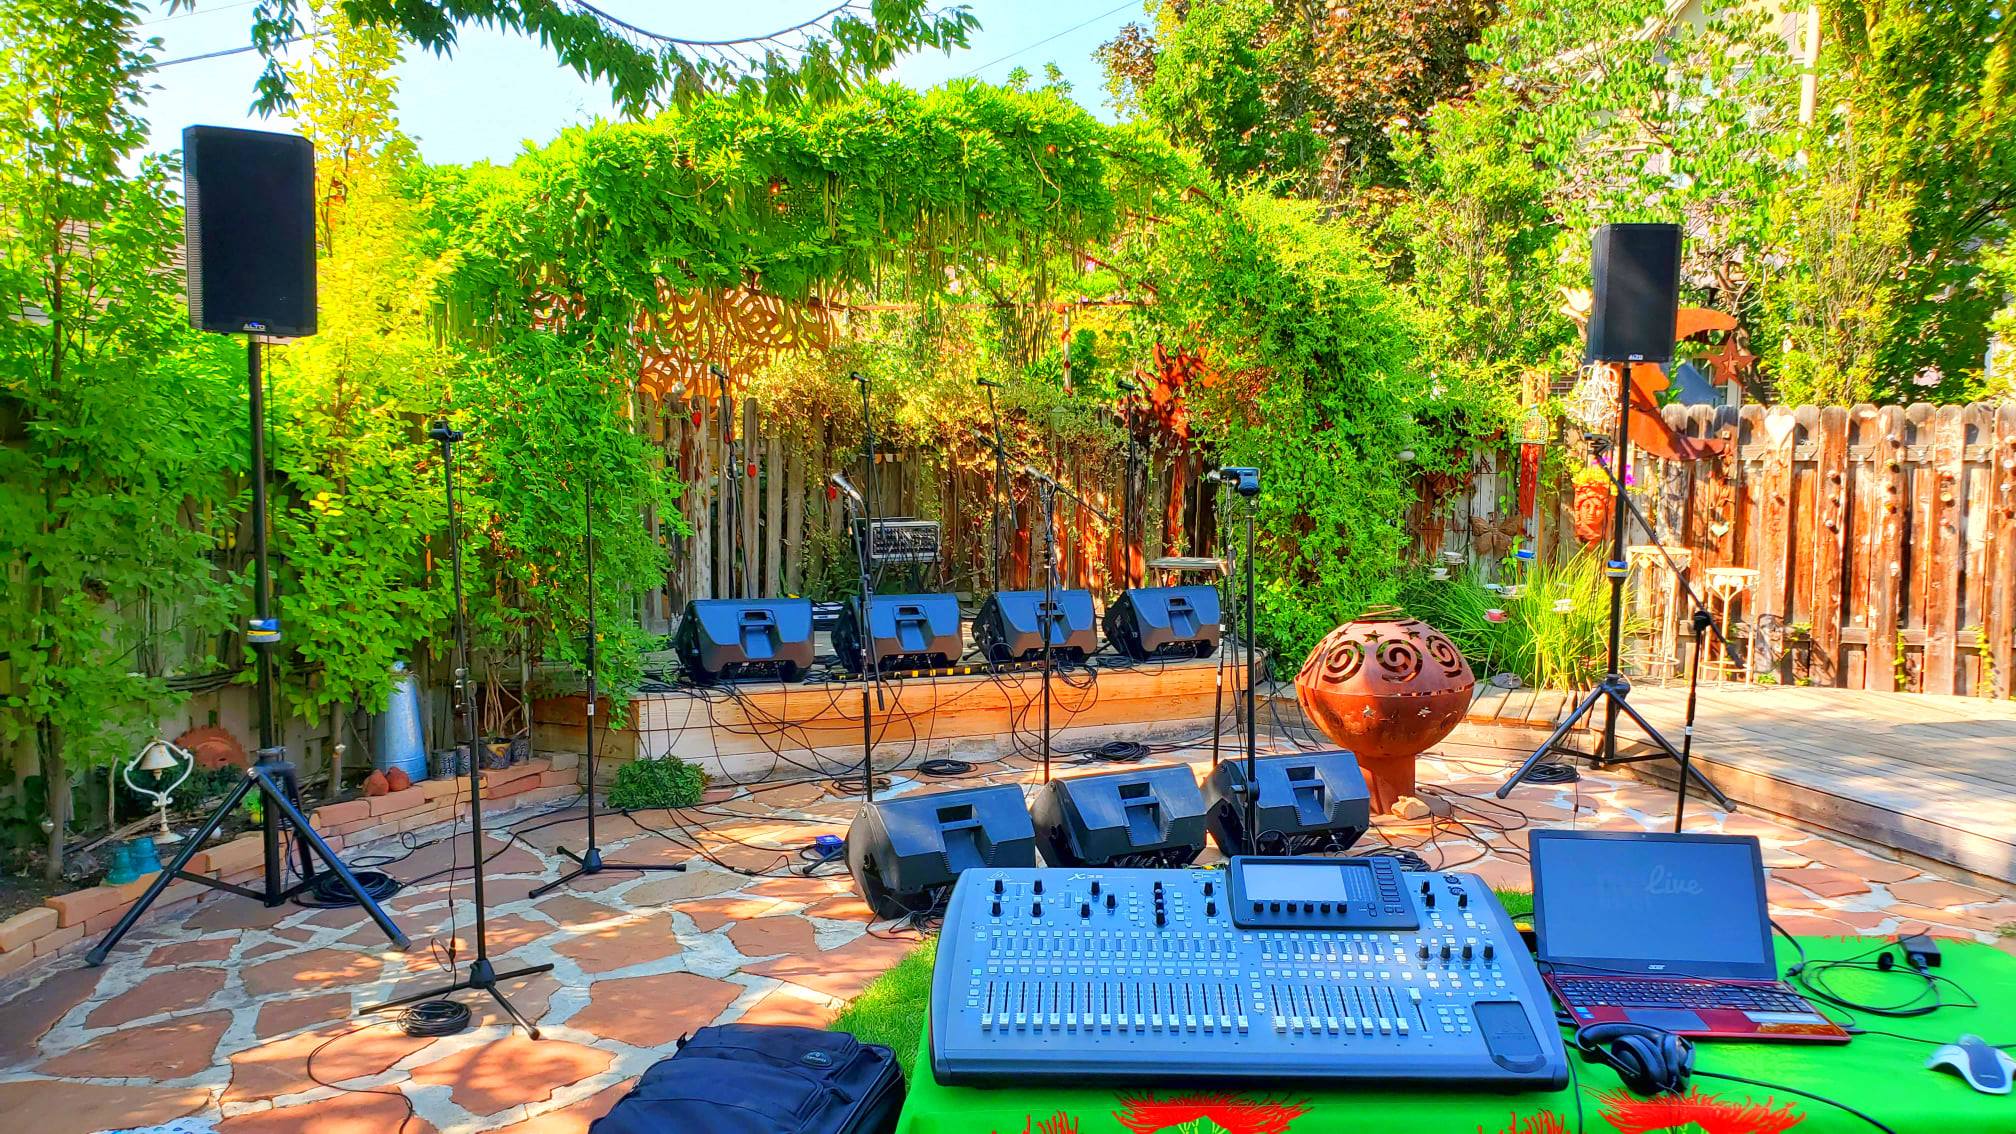
If you’re new to this site, you may not know about the mix rig that I use regularly. It’s a custom-built console that runs on general computing hardware. It started as a SAC build, but I switched to Reaper and have stayed there ever since.

To the extent that you’re talking about raw connectivity, a computer-hosted mix system is pre-primed for remote control. Any modern computer and accessible operating system will include facilities for “talking” to other devices over a network. Those connectivity facilities will be, at a basic level, easy to configure.

(It’s kind of an important thing these days, what with the Internet and all.)

So, when a local retailer was blowing out 10″ Android tablets for half price, I thought, “Why not?” I had already done some research and discovered that VNC apps could be had on Android devices, and I’ve set up VNC servers on computers before. (It’s not hard, especially now that the installers handle the network security configuration for you.) In my mind, I wasn’t trying to do anything exotic.

And I was right. Once I had a wireless network in place and all the necessary software installed, getting a remote connection to my console machine was as smooth as butter. Right there, on my tablet, was a view of my mixing console. I could navigate around the screen and click on things. It all looked very promising.

There’s a big difference between basic interaction and really being able to work, though. When it all came down to it, I couldn’t easily do the substantive tasks that would make having a remote a handy thing. It didn’t take me long to realize that tuning monitors while standing on the deck was not something I’d be able to do in a professional way.

A Gooey GUI Problem

At the practical level, the problem I was having was an interface mismatch. That is, while my tablet could display the console interface, the tablet’s input methodology wasn’t compatible with the interface being displayed.

Now, what the heck does that mean?

Reaper (and lots of other audio-workstation interfaces) are built for high-precision pointing devices. You might not think of a mouse or trackball as “high precision,” but when you couple one of those input devices with the onscreen pointer, high precision is what you get. The business-end of the pointer is clearly visible, only a few pixels wide, and the “interactivity radius” of the pointer is only slightly larger. There is an immediately obvious and fine-grained discrimination between what the pointer is set to interact with, and what it isn’t. With this being the case, the software interface can use lots of small controls that are tightly packed.

Additionally, high-precision pointing allows for fast navigation across lots of screen area. If you have the pointer in one area of the screen and invoke, say, an EQ window that pops open in another area, it’s not hard to get over to that EQ window. You flick the mouse, your eye finds the pointer, you correct on the fly, and you very quickly have control localized to the new window. (There’s also the whole bonus of being able to see the entire screen at once.) With high-precision input being available, the workstation software can make heavy use of many independent windows.

Lastly, mice and other high-precision pointers have buttons that are decoupled from the “pointing” action. Barring some sort of failure, these buttons are very unambiguous. When the button is pressed, it’s very definitely pressed. Clicks and button holds are sharply delineated and easily parsed by both the machine and the user. The computer gets an electrical signal, and the user gets tactile feedback in their fingers that correlates with an audible “click” from the button. This unambiguous button input means that the software can leverage all kinds of fine-grained interactions between the pointer position and the button states. One of the most important of those interactions is the dragging of controls like faders and knobs.

So far so good?

The problem starts when an interface expecting high-precision pointing is displayed on a device that only supports low-precision pointing. Devices like phones and tablets that are operated by touch are low-precision.

Have you noticed that user interfaces for touch-oriented devices are filled with big buttons, “modal” elements that take over the screen, and expectations for “big” gestures? It’s because touch control is coarse. Compared to the razor-sharp focus of a mouse-driven pointer, a finger is incredibly clumsy. Your hand and finger block a huge portion of the screen, and your finger pad contacts a MASSIVE area of the control surface. Sure, the tablet might translate that contact into a single-pixel position, but that’s not immediately apparent (or practically useful) to the operator. The software can’t present you with a bunch of small subwindows, as the miniscule interface elements can’t be managed easily by the user. In addition, the only way for the touch-enabled device to know the cursor’s location is for you to touch the screen…but touch, by necessity, has to double as a “click.” Interactions that deal with both clicks and movement have to be forgiving and loosely parsed as a result.

Tablets don’t show big, widely spaced controls in a single window because it looks cool. They do it because it’s practical. When a tablet displays a remote interface that’s made for a high-precision input methodology, life gets rather difficult:

“Oh, you want to display a 1600 x 900, 21″ screen interface on a 1024 X 600, 10″ screen? That’s cool, I’ll just scale it down for you. What do you mean you can’t interact with it meaningfully now?”

“Oh, you want to open the EQ plugin window on channel two? Here you go. You can’t see it? Just swipe over to it. What do you mean you don’t know where it is?”

“Oh, you want to increase the send level to mix three from channel four? Nice! Just click and drag on that little knob. That’s not what you touched. That’s also not what you touched. Try zooming in. I’m zoomi- wait, you just clicked the mute on channel five. Okay, the knob’s big now. Click and drag. Wait…was that a single click, or a click and hold? I think that was…no. Okay, now you’re dragging. Now you’ve stopped. What do you mean, you didn’t intend to stop? You lifted your finger up a little. Try again.”

With an interface mismatch, everything IS doable…but it’s also VERY slow, and excruciatingly difficult compared to just walking back to the main console and handling it with the mouse. Muting or unmuting a channel is easy enough, but mixing monitors (and fighting feedback) requires swift, smooth control over lots of precision elements. If the interface doesn’t allow for that, you’re out of luck.

Control States VS. Pictures Of Controls

So, can systems be successfully operated by remotes that don’t use the same input methodology as the native interface?

Of course! That’s why traditional-surface digital consoles can be run from tablets now. The tablet interfaces are purpose-built, and involve “state” information about the main console’s controls. My remote-control solution didn’t include any of that. The barrier for me is that I was trying to use a general-purpose solution: VNC.

With VNC, the data transmitted over the network is not the state of the console’s controls. The data is a picture of the console’s controls only, with no control-state data involved.

That might seem confusing. You might be saying, “But there is data about the state of the controls! You can see where the faders are, and whether the mutes are pressed, and so on.”

Here’s the thing, though. You’re able to determine the state of the controls because you can interpret the picture. That determination you’ve made, however, is a reconstruction. You, as a human, might be seeing a picture of a fader at a certain level. Because that picture has a meaning that you can extract via pattern recognition, you can conceptualize that the fader is in a certain state – the state of being at some arbitrary level of gain. To the computer, though, that picture has no meaning in terms of where that fader is.

When my tablet connects to the console via VNC, and I make the motions to change a control’s state, my tablet is NOT sending information to the console about the control I’m changing. The tablet is merely saying “click at this screen position.” For example, if clicking at that screen position causes a channel’s mute to toggle, that’s great – but the only machine aware of that mute, or whether that mute is engaged or disengaged, is the console itself. The tablet itself is unaware. It’s up to me to look at the updated picture and decide what it all means…and that’s assuming that I even get an updated picture.

The cure to all of this is to build a touch-friendly interface which is aware of the state of the controls being operated. You can present the knobs, faders, and switches in whatever way you want, because the remote-control information only concerns where that control should be set. The knobs and faders sit in the right place, because the local device knows where they are supposed to be in relation to their control state. Besides solving the “interface mismatch” problem, this can also be LIGHT YEARS more efficient.

(Disclaimer: I am not intimately aware of the inner workings of VNC or any console-remote protocol. What follows are only conjectures, but they seem to be reasonable to me.)

Sending a stream of HD (or near HD) screenshots across a network means quite a lot of data. If you’re using jpeg-esque compression, you can crush each image down to 100 kilobytes and still have things be usable. VNC can be pretty choosy about what it updates, so let’s say you only need one full image every second. You won’t see meters move smoothly or anything like that, but that’s the price for keeping things manageable. The data rate is about 819 kbits/ second, plus the networking overhead (packet headers and other communication).

Now then. Let’s say we’ve got some remote-control software that handles all “look and feel” on the local device (say, a tablet). If you represent a channel as an 8-bit identifier, that means you can have up to 256 channels represented. You don’t need to actually update each channel all the time to simply get control. Data can just be sent as needed, of course. However, if you want to update the channel meters 30 times per second, that meter data (which could be another 8-bit value) has to be attached to each channel ID. So, 30 times a second, 256 8-bit identifiers get 8-bits of meter information data attached to each of them. Sixteen bits multiplied by 256 channels, multiplied by 30 updates/ second works out to about 123 kbits/ second.

Someone should check my math and logic, but if I’m right, nicely fluid metering across a boatload of channels is possible at less than 1/6th the data rate of “send me a screenshot” remote control. You just have to let the remote device handle the graphics locally.

Control-state changes are even easier. A channel with fader, mute, solo, pan, polarity, a five-selection routing matrix, and 10 send controls needs to have 20 “control IDs” available. A measly little 5-bit number can handle that (and more). If the fader can handle 157 “integer” levels (+12 dB to -143 dB and “-infinity”) with 10 fractional levels of .1 dB between each integer (1570 values total), then the fader position can be more than adequately represented by an 11-bit number. If you touch a fader and the software sends a control update every 100th of a second, then a channel ID, control ID, and fader position have to be sent 100 times per second. That’s 24 bits multiplied by 100, or 2.4 kbits/ second.

That’s trivial compared to sending screenshots across the network, and still almost trivial when compared to the “not actually fast” data rate required to update the meters all the time.

Again, let me be clear. I don’t actually know if this is how “control state” remote operation works. I don’t know how focused the programmers are on network data efficiency, or even if this would be a practical implementation. It seems plausible to me, though.

I’m rambling at this point, so let me tie all this up: Remote control is nifty, and you can get the basic appearance of remote control with a general purpose solution like VNC. If you really need to get work done in a critical environment, though, you need a purpose built solution that “plays nice” at both the local and remote ends.