Tag Archives: Math

Hitting The Far Seats

A few solutions to the “even coverage” problem, as it relates to distance.

Please Remember:

The opinions expressed are mine only. These opinions do not necessarily reflect anybody else’s opinions. I do not own, operate, manage, or represent any band, venue, or company that I talk about, unless explicitly noted.

Want to use this image for something else? Great! Click it for the link to a high-res or resolution-independent version.

This article, like the one before it, isn’t really “small venue” in nature. However, I think it’s good to spend time on audio concepts which small-venue folk might still run across. I’m certainly not “big-time,” but I still do the occasional show that involves more people and space. I (like you) really don’t need to get engaged with a detailed discussion regarding an enormous system that I probably won’t ever get my hands on, but the fundamentals of covering the people sitting in the back are still valuable tools.

This article is also very much a follow up to the piece linked above. Via that lens, you can view it as a discussion of what the viable options are for solving the difficulties I ran into.

So…

The way that you get “throw” to the farthest audience members is dependent upon the overall PA deployment strategy you’re using. Deployment strategies are dependent upon the gear in question being appropriate for that strategy, of course; You can’t choose to deploy a bunch of point-source boxes as a line-array and have it work out very well. (Some have tried. Some have thought it was okay. I don’t feel comfortable recommending it.)

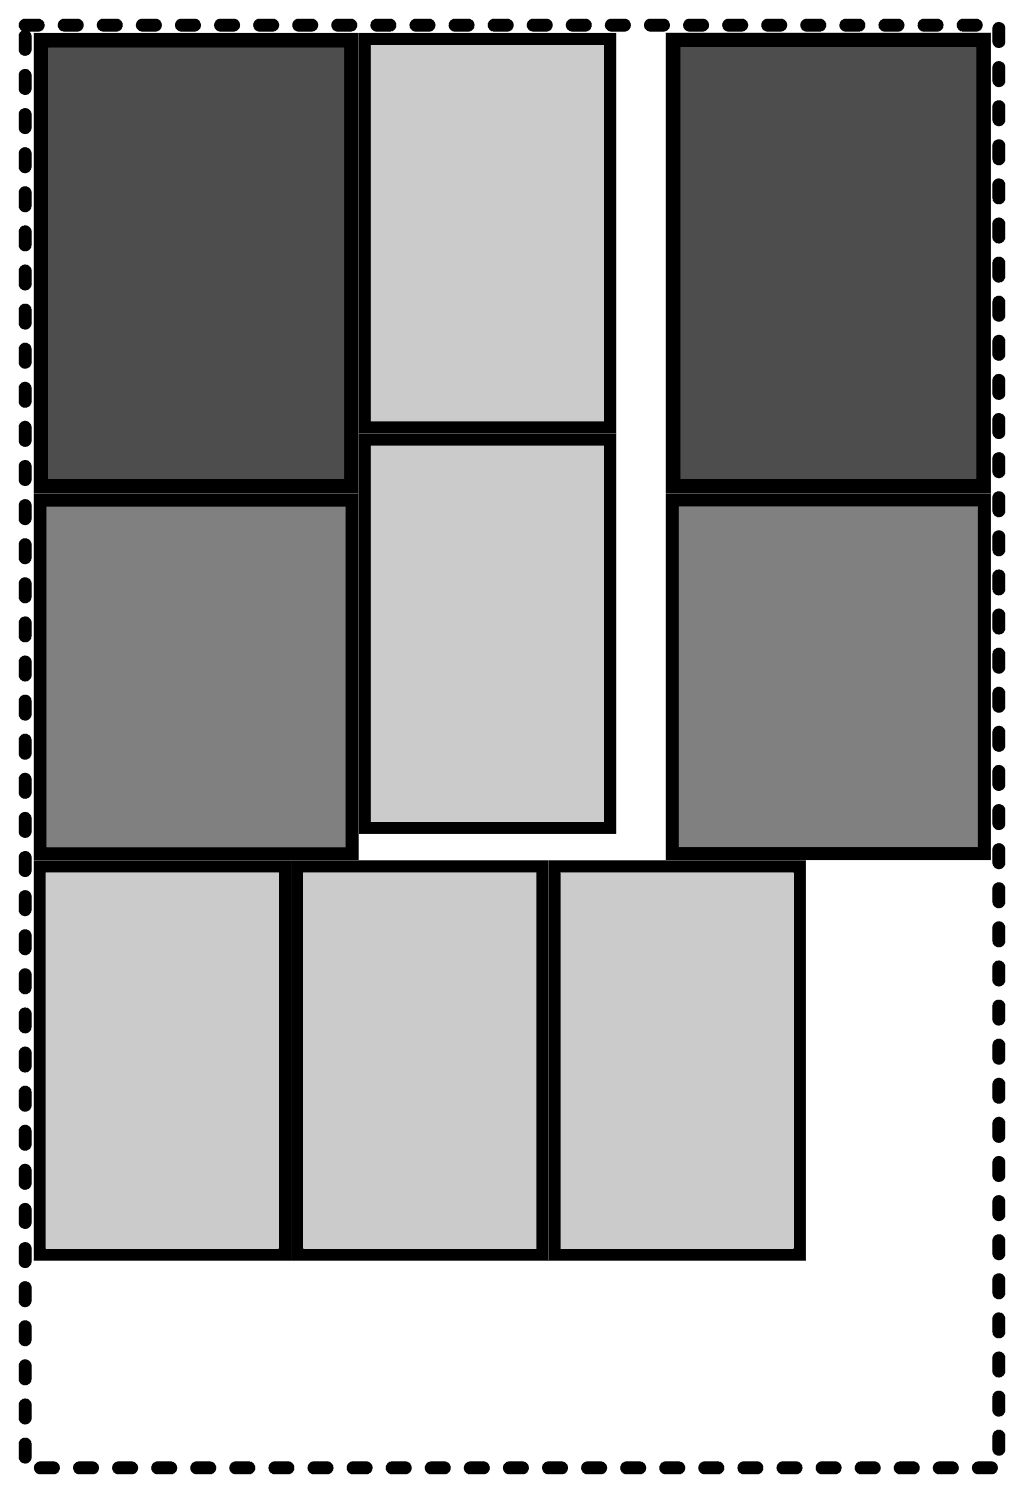
Option 1: Single Arrival, “Point Source” Flavor

You can build a tall stack or hang an array with built-in, non-changeable angles, but both cases use the same idea: Any given audience member should really only hear one box (per side) at a time. Getting the kind of directivity necessary for that to be strictly true is quite a challenge at lower frequencies, so the ideal tends to not be reached. Nevertheless, this method remains viable.

I’ve termed this deployment flavor as “single arrival” because all sound essentially originates at the same distance from any given audience member. In other words, all the PA loudspeakers for each “side” are clustered as closely as is practical. The boxes meant to be heard up close are run at a significantly lower level than the boxes meant to cover the far-field. A person standing 50 feet from the stage might be hearing a loudspeaker making 120 dB SPL at 3 feet, whereas the patrons sitting 150 feet away would be hearing a different box – possibly stacked atop the first speaker – making 130 dB SPL at 3 feet. As such, the close-range listener is getting about 96 dB SPL, and the far-field audience member also hears a show at roughly 96 dB SPL.

This solution is relatively simple in some respects, though it requires the capability of “zone” tuning, as well as loudspeakers capable of high-output and high directivity. (You don’t want the up-close audience to get cooked by the loudspeaker that’s making a ton of noise for the long-distance people.)

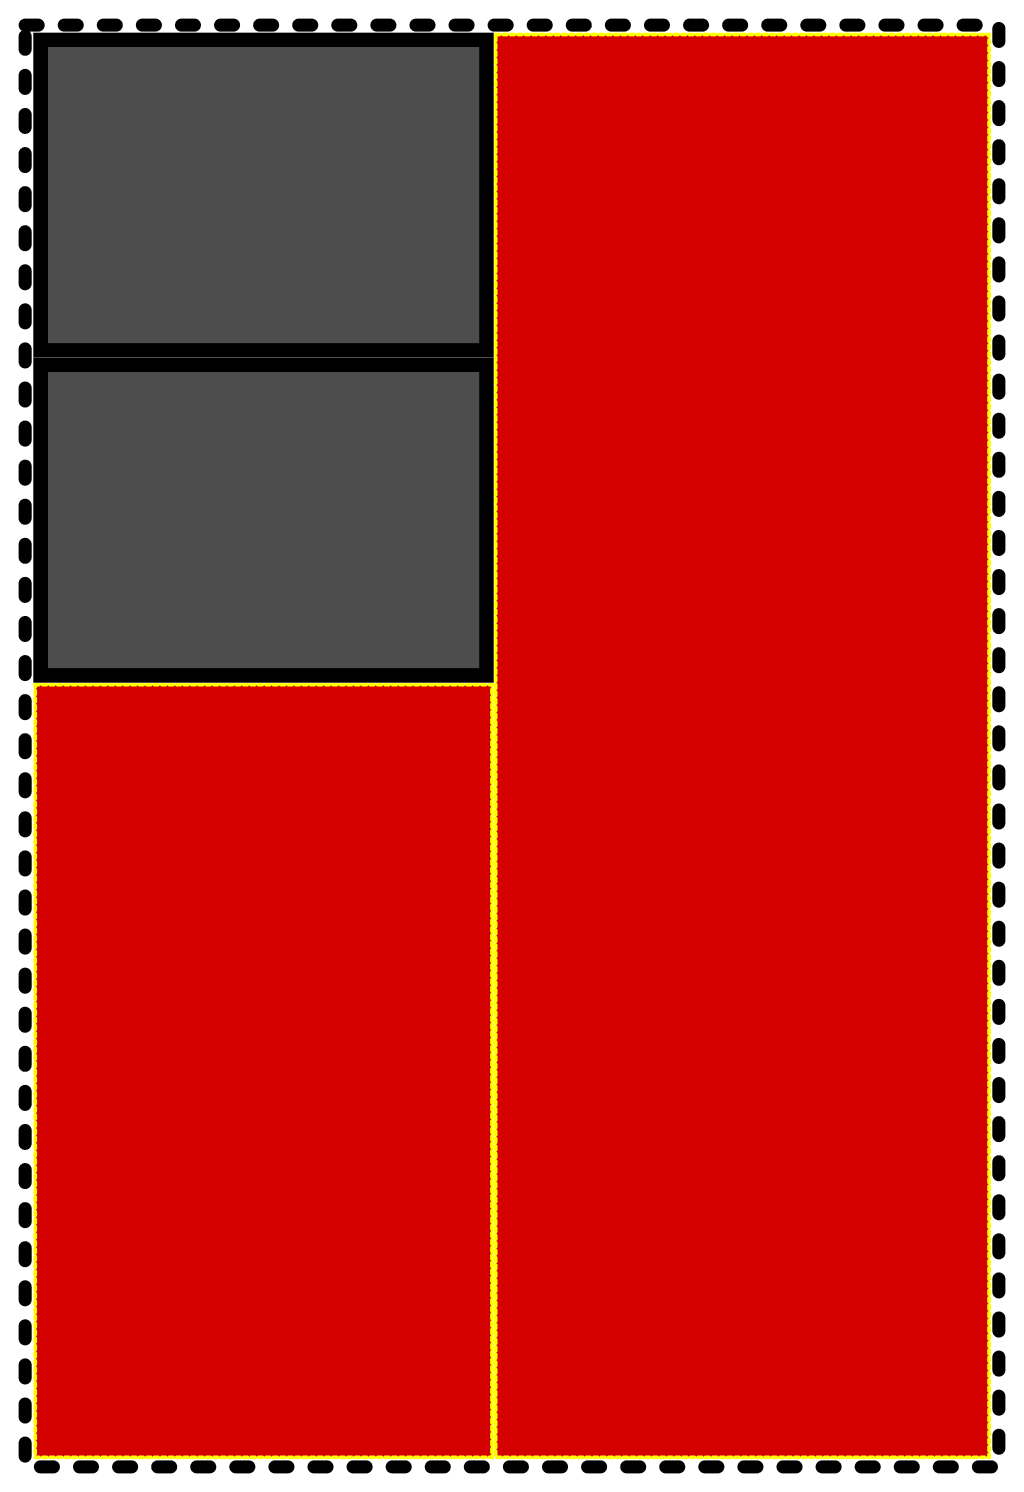
Option 2: Single Arrival, Line-Array Flavor

As in the point source flavor, you have one array deployed “per side,” with each individual box as close to the other boxes as is achievable. The difference is that an honest-to-goodness line-array is meant to work by the audible combination of multiple loudspeakers. At very close distances, it may be possible to only truly hear a small part of the line, and this does help in keeping the nearby listeners from having their faces ripped off. However, the overall idea is to create a radiation pattern that resembles a section of a cylinder. (Perfect achievement of such a pattern isn’t really feasible.) This is in contrast to point-source systems, where the pattern tends towards a section of a sphere.

As is the case in many areas of life, everything comes down to surface area. A sphere’s surface area is 4*pi*radius^2, whereas the lateral surface area of a cylinder is 2*pi*radius*height. The perceived intensity of sound is the audible radiation spread across the surface area of the radiation geometry. More surface area means less intensity.

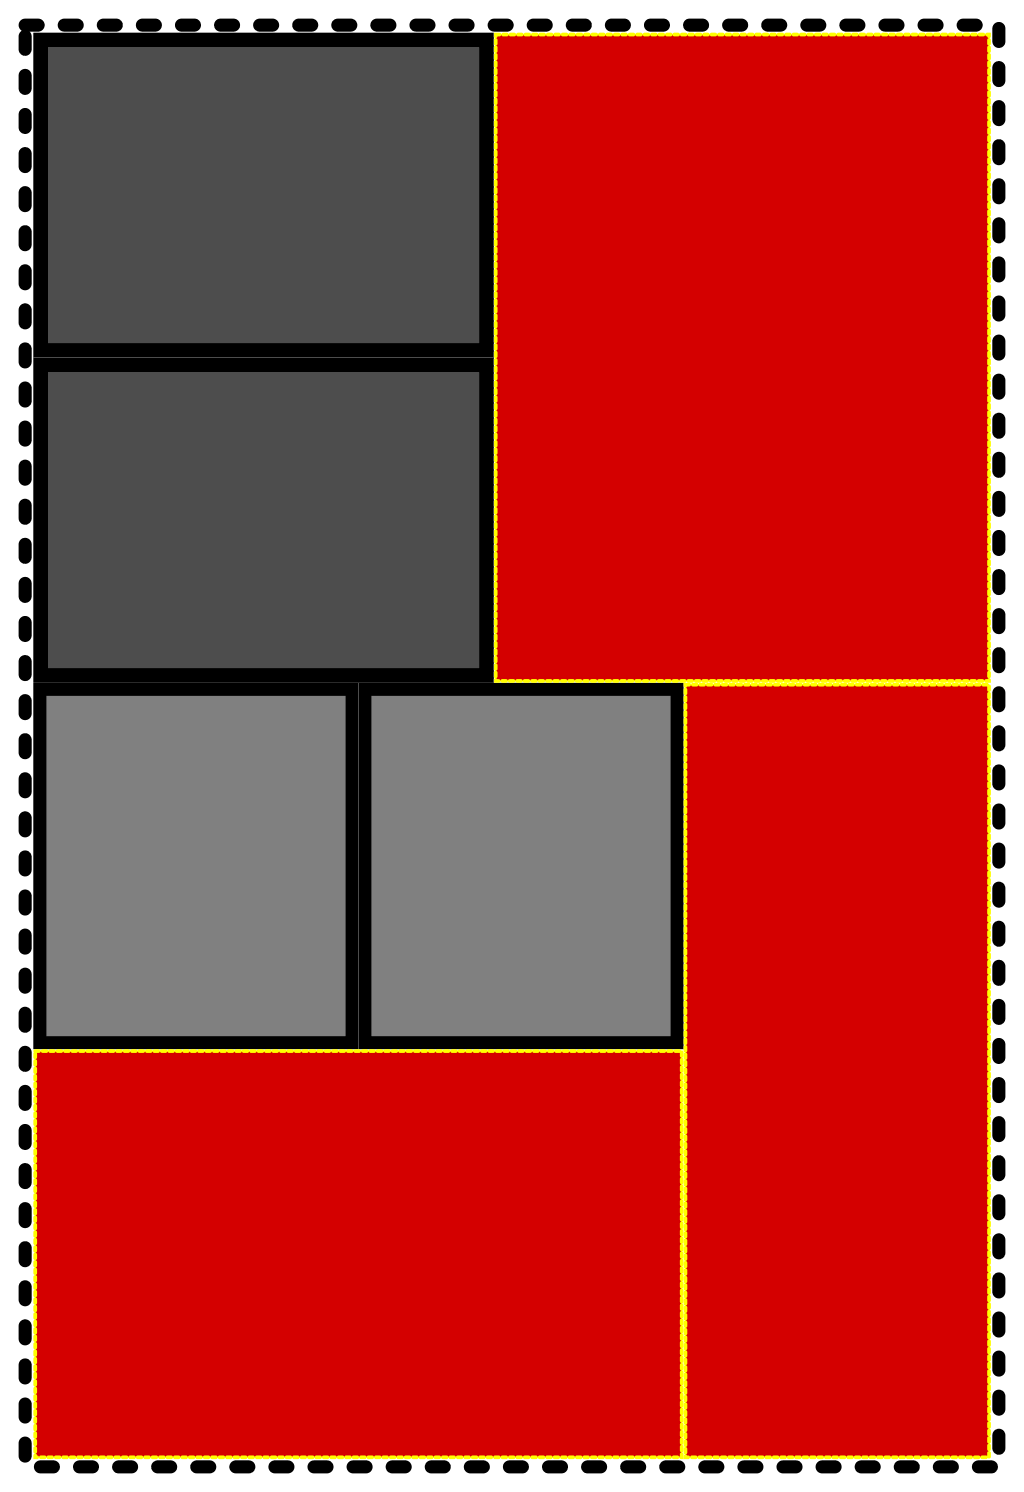
To keep the calculations manageable, I’ll have to simplify from sections of shapes to entire shapes. Even so, some comparisons can be made: At a distance of 150 feet, the sound power radiating in a spherical pattern is spread over a surface area of 282,743 square feet. For a 10-foot high cylinder, the surface area is 9424 square feet.

For the sphere, 4 watts of sound power (NOT electrical power!) means that a listener at the 150 foot radius gets a show that’s about 71 dB. For the cylinder, the listener at 100 feet should be getting about 86 dB. At the close-range distance of 50 feet, the cylindrical radiation pattern results in a sound level of 91 dB, whereas a spherical pattern gets 81 dB.

Putting aside for the moment that I’m assuming ideal and mathematically easy conditions, the line-array has a clear advantage in terms of consistency (level difference in the near and far fields) without a lot of work at tuning individual boxes. At the same time, it might not be quite as easily customizable as some point-source configurations, and a real line-source capable of rock-n-roll volume involves a good number of relatively expensive elements. Plus, a real line has to be flown, and with generous trim height as well.

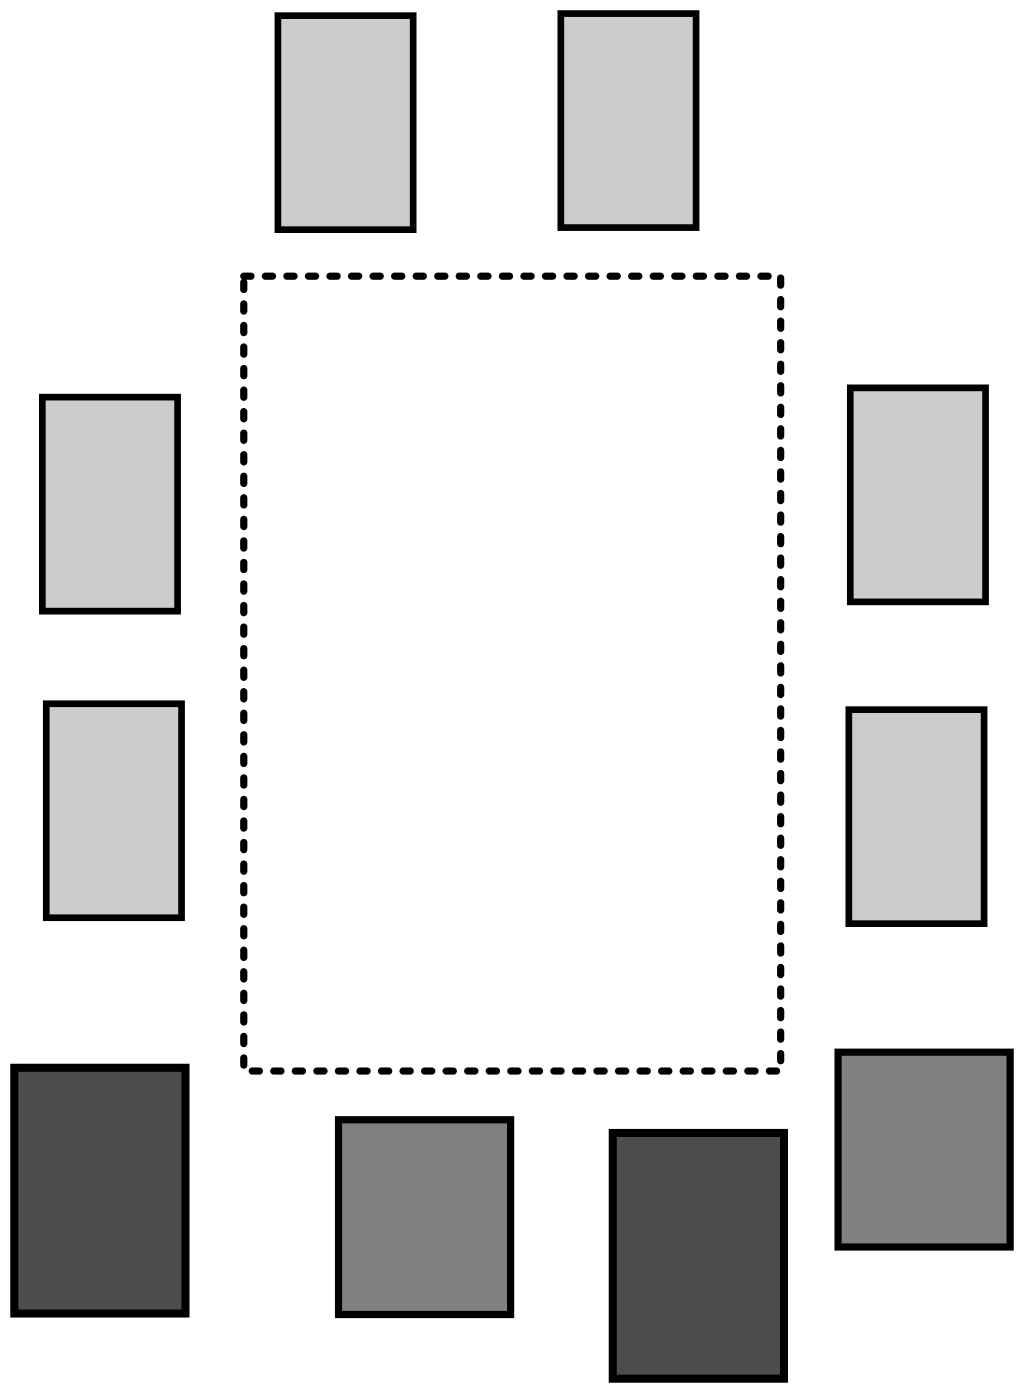
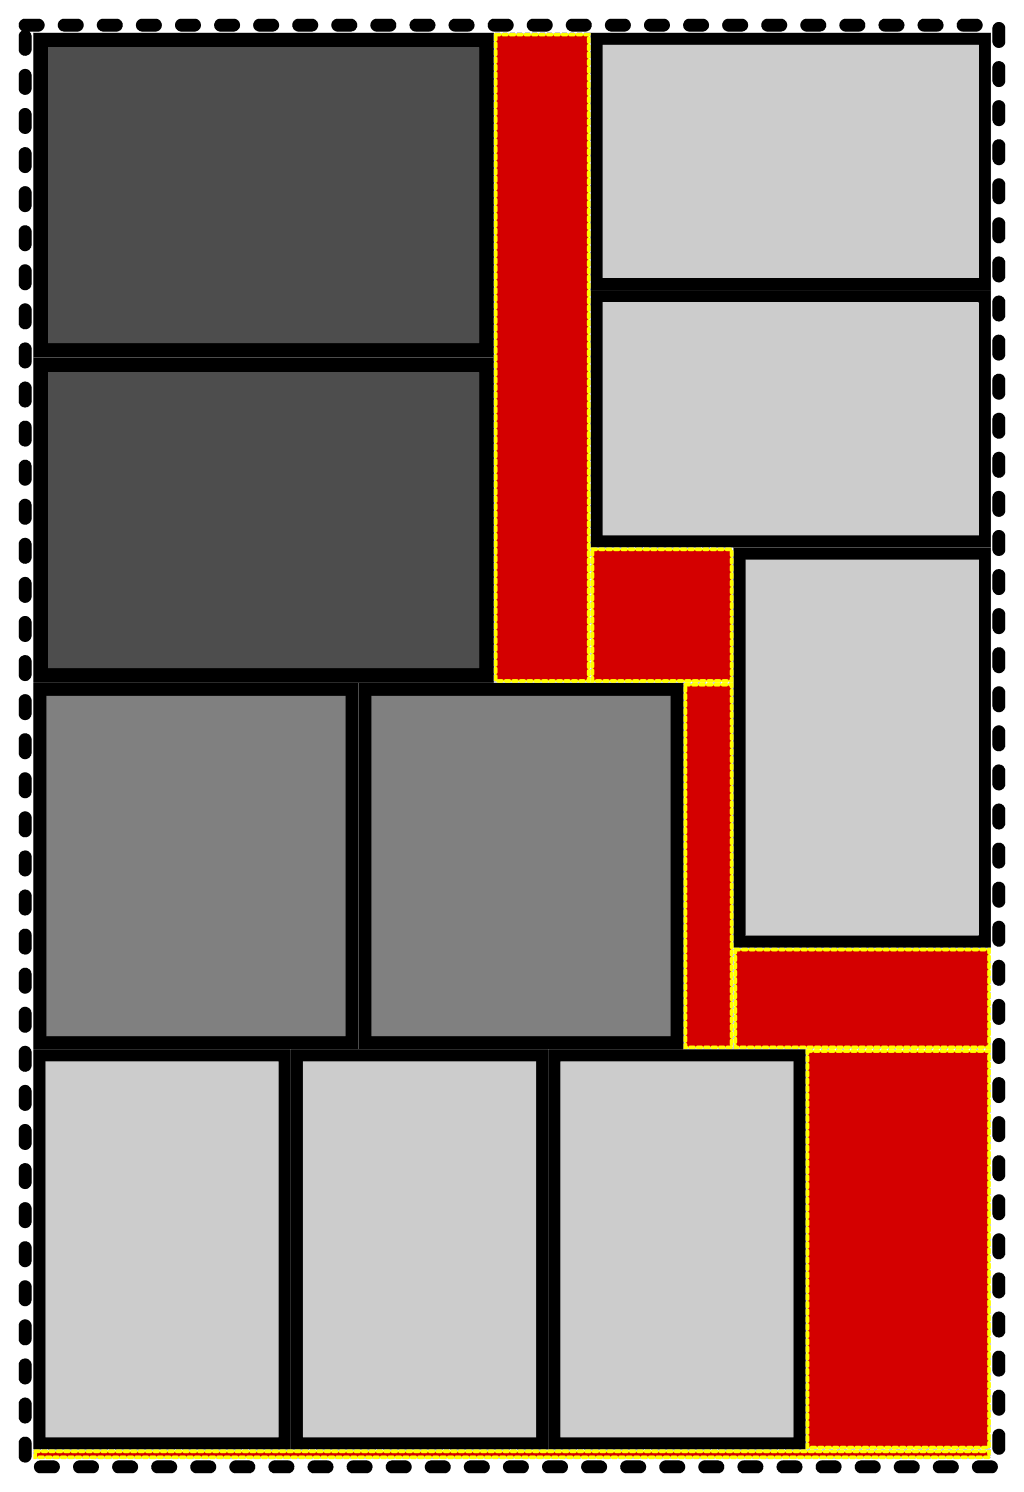
Option 3: Multiple Arrival, Any Flavor

This is otherwise known as “delays.” At some convenient point away from the main PA system, a supplementary PA is set. The signal to that supplementary PA is made to be late, such that the far system aligns pleasingly with the sound from the main system. The hope is that most people will overwhelmingly hear one system over the other.

The point with this solution is to run everything more quietly and more evenly by making sure that no audience member is truly in the deep distance. If each PA only has to cover a distance of 75 feet, then an SPL of 90 dB at that distance requires 118 dB at 3 feet.

The upside to this approach is that the systems don’t have to individually be as powerful, nor do they strictly need to have high-directivity (although it’s quite helpful in keeping the two PA systems separate for the listeners behind the delays). The downside is that it requires more space and more rigging – whether actual rigging or just loudspeakers raised on poles, stacks, or platforms. Additionally, you have to deal with more signal and/ or power runs, possibly in difficult or high-traffic areas. It also requires careful tuning of the delay time to work properly, and even then, being behind or to the side of the delays causes the solution to be invalid. In such a condition where both systems are quite audible, the coherence of the reproduced audio suffers tremendously.


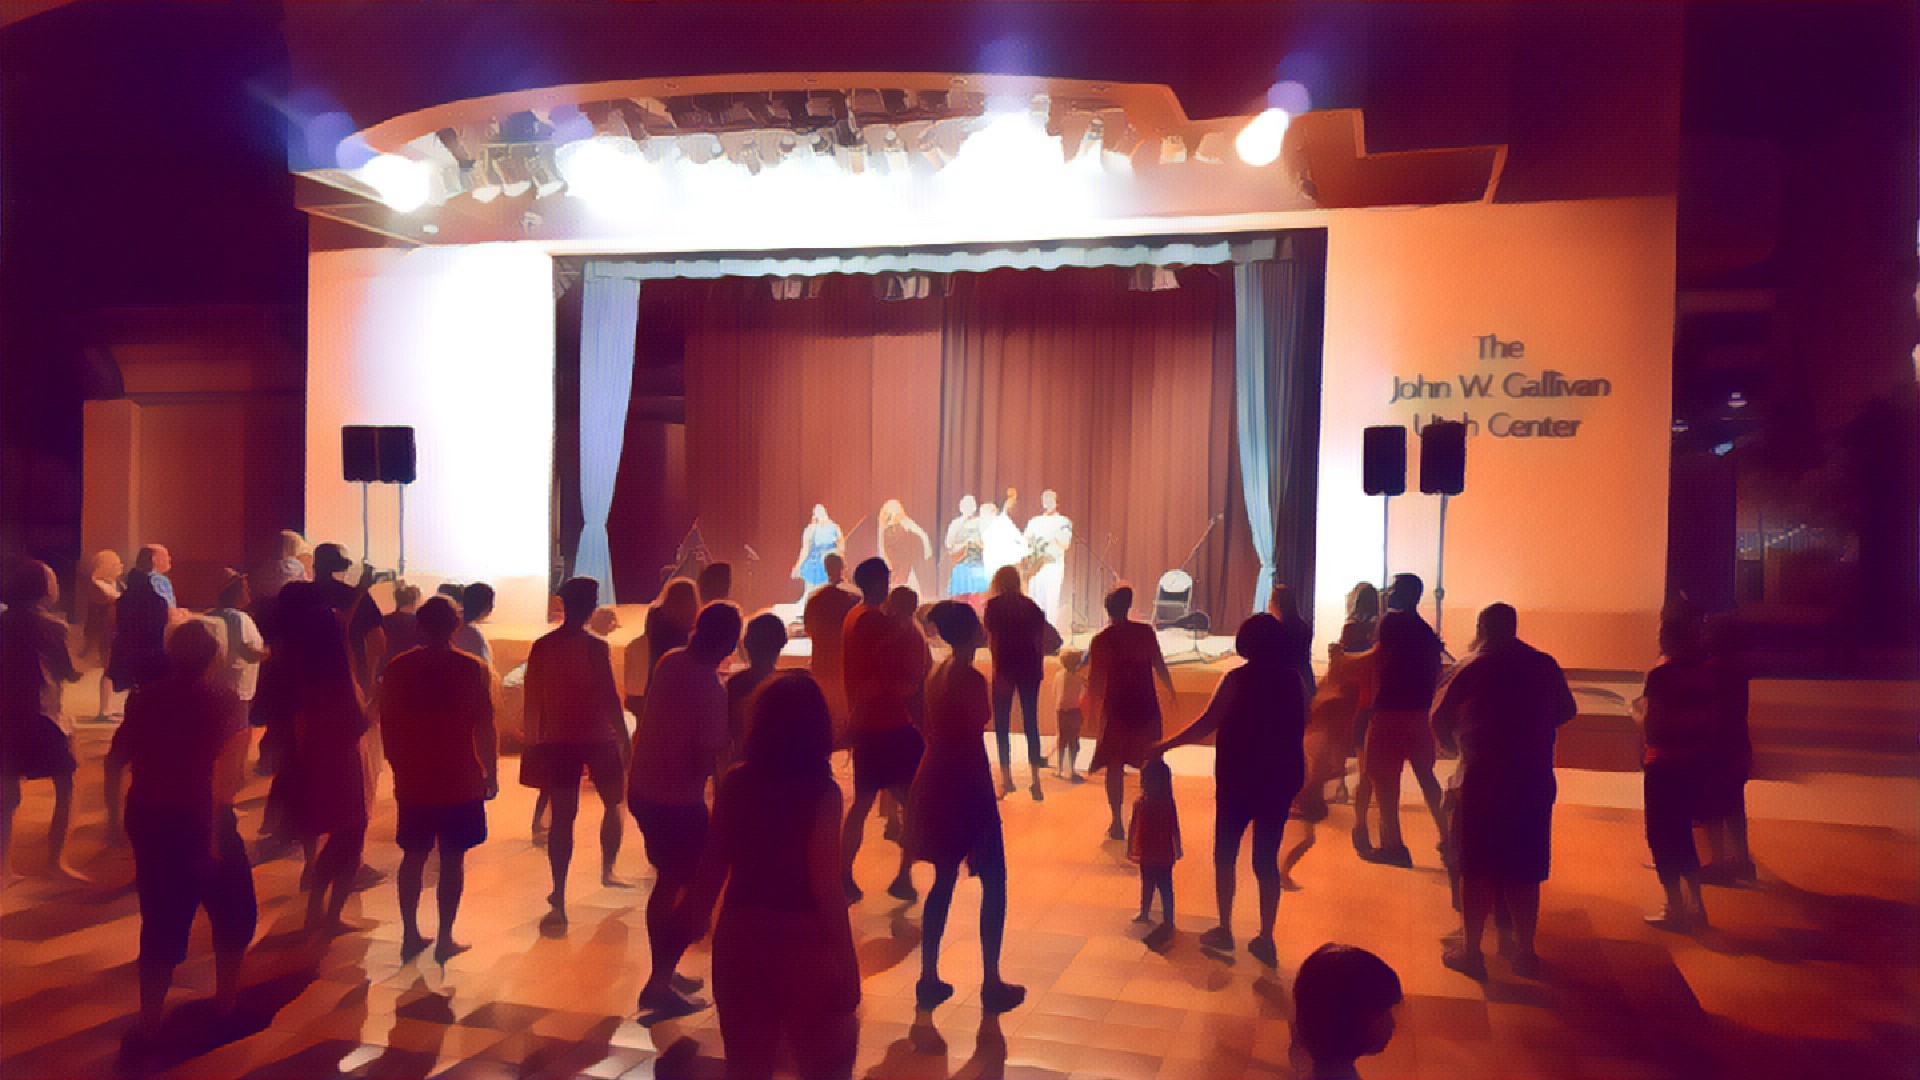
If I end up trying the Gallivan show again, I think I’ll go with delays. I don’t have the logistical resources to handle big, high-output point-source boxes or a real array. I can, on the other hand, find a way to boxes up on sticks with delay applied. I can’t say that I’m happy about the potential coherence issues, but everything in audio is a compromise in some way.


The Decibel…And You

Logarithmic scales are groovy.

Please Remember:

The opinions expressed are mine only. These opinions do not necessarily reflect anybody else’s opinions. I do not own, operate, manage, or represent any band, venue, or company that I talk about, unless explicitly noted.

Want to use this image for something else? Great! Click it for the link to a high-res or resolution-independent version.

The video:

About the music playing underneath the narration:

Frost Waltz by Kevin MacLeod is licensed under a Creative Commons Attribution license (https://creativecommons.org/licenses/by/4.0/)
Source: http://incompetech.com/music/royalty-free/index.html?isrc=USUAN1100516
Artist: http://incompetech.com/

Here’s the narration script, if you like:

The decibel – what is it?

The decibel is a nonlinear unit of measure created by Bell Telephone Laboratories. In telecommunications systems and professional audio applications, it is often necessary to compare large differences in measured power. This can be inconvenient with linear units.

The decibel solves this problem using a logarithmic scale. No, no, not phat beats being produced by striking a piece of wood at regular intervals. The logarithm: The inverse of an exponent. Logarithmic scales compact large, linear ranges of values into a much more manageable form. The logarithm used by the decibel is concerned with powers of 10, hence it is a base-10 logarithm. Be sure that any decibel calculations you perform use a base-10 logarithm; Some mathematics systems default to the natural logarithm instead.

The decibel is a unit that describes a power ratio. As such, you should be aware of three main rules for the use of this unit: First, that the decibel has no meaning unless a reference point is designated. Second, this reference point is the denominator for the ratio, and thus, must not be zero. Third, logarithms are only valid for ratios with a positive value. A decibel value can be negative, but the input ratio must not be.

All sorts of reference points for decibels exist. There is dBW, which references one watt of power. There is dBu, which references 0.775 volts RMS, un-terminated. There is dBSPL, which references 20 micro Pascals, the threshold of human hearing at 1 Khz.

For a power ratio, the decibel value is the 10 times the base-10 logarithm of the ratio. A ratio of one – that is, the reference point itself, is always zero decibels. Ratios greater than one give positive decibel values, whereas ratios less than one give negative results.

But wait, you say! Professional audio is often concerned with voltage, yet the decibel is concerned with power. How can we square that circle?

Remember that voltage can be related to power in various ways. One such form is this: Power equals voltage squared over resistance. Because we are concerned with the ratio of voltages, and not the actual power value, we can set the resistances as being equal to one. This leaves us with voltage squared over voltage squared. This may seem clumsy to calculate, but never fear! The same result may be obtained by multiplying the base-10 logarithm of the simple voltage ratio by 20 instead of 10. Isn’t that swell?

The decibel is a versatile unit of measure that can be adapted to many needs in the professional audio world. Know it, and use it well.


Why Are Faders Labeled Like That?

Gain multipliers are hard to read.

Please Remember:

The opinions expressed are mine only. These opinions do not necessarily reflect anybody else’s opinions. I do not own, operate, manage, or represent any band, venue, or company that I talk about, unless explicitly noted.

Want to use this image for something else? Great! Click it for the link to a high-res or resolution-independent version.

I’ve done a lot of typing on this site, and I’m worried that it’s getting stale – so, how about some video?


The Mathematical Key To Truck Pack Tetris

The emptiness is as important as what is filled, grasshopper.

Please Remember:

The opinions expressed are mine only. These opinions do not necessarily reflect anybody else’s opinions. I do not own, operate, manage, or represent any band, venue, or company that I talk about, unless explicitly noted.

3dtetrisWant to use this image for something else? Great! Click it for the link to a high-res or resolution-independent version.

The world of live audio has many frustrating moments wrapped inside it, but very few of those moments is as frustrating as when the cargo vehicle refuses to wrap enough gear inside of itself. If you haven’t come to the end of your cargo space with one more box left to go inside, you may not actually have done this job.

Those of us who have spent a significant time either generating or augmenting musical noises will, generally, have gotten an intuitive grasp of “truck packing.” It’s basically 3D Tetris. You try to find nooks and crannies that might fit your gear, and then you rotate and relocate that gear to wedge into the hole you found. This process is repeated until you run out of gear to pack, or you run out of room (at 1 AM, with snow falling, a flood of tears welling up in your eyes, and a growing urge to sit down with an alcoholic beverage so as to re-examine your life).

Sometimes you run out of room because you simply have too much gear for the truck, van, SUV, moose-powered sleigh, or jet-equipped platypus. At other times, though, you get stymied due to bad math. Packing is applied geometry, and geometry, like all regular math, runs on a system of predictable rules.

The key rule to getting the most out of your cargo space can’t be talked about until we establish the meta-rule, however:

All cargo-packing must be done in a way that allows the cargo vehicle to be operated safely. If a mathematically perfect pack prevents the vehicle from being operated safely, the pack must be changed.

So, there’s the meta-rule. Here’s the key bit of math, assuming that you start with the largest items first (they have the least flexibility in terms of finding a space to squeeze into):

At any point in the pack, the remaining cargo space can be subdivided into one more more volumes described by a rectangular prism (a cubic or rectangular box). Each imaginary box of remaining space should be as large as possible; The number of imaginary boxes should be as few as possible.

In real life, this is a 3D problem. However, to make it easier to visualize, I’ll show some 2D examples. Below is our 2D cargo vehicle, with 2D roadcases strewn all around. If we can arrange the cases such that they are inside the dotted outline of our cargo vehicle, we can get to the gig.

empty

Our first try doesn’t go so well. There are supposed to be six of those light grey boxes, but we only got five in the van. The pack looks very efficient and orderly, but it doesn’t work.

oops

But, if we’re careful about continually maximizing the remaining, contiguous space during the pack, we actually make it. It’s important to note that concessions have to be made for other, physical practicalities, like generally being able to load the vehicle from the front to the back.

step1

step2

step3

step4

step5

The end result doesn’t look as orderly as our first try, but it actually lets us transport all the necessary boxes.


How Much Light For Your Dollar?

Measurements and observations regarding a handful of relatively inexpensive LED PARs.

Please Remember:

The opinions expressed are mine only. These opinions do not necessarily reflect anybody else’s opinions. I do not own, operate, manage, or represent any band, venue, or company that I talk about, unless explicitly noted.

box_of_lightsWant to use this image for something else? Great! Click it for the link to a high-res or resolution-independent version.

I’m in the process of getting ready for a pretty special show. The album “Clarity” by Sons Of Nothing is turning 10, and a number of us are trying to put together one smasher of a party.

Of course, that means video.

And our master of all things videographic is concerned about having enough light. We can’t have anybody in the band who’s permanently stuck in “shadow.” You only get one chance to shoot a 10th anniversary concert, and we want to get it right.

As such, I’m looking at how to beef up my available lighting instruments. It’s been a long while since I’ve truly gone shopping for that old mainstay of small-venue lighting, the LED wash PAR, but I do take a look around every so often. There’s a lot to see, and most of it isn’t very well documented. Lighting manufacturers love to tell you how many diodes are in a luminaire, and they also like to tell you how much power the thing consumes, but there appears to be something of an allergy to coughing up output numbers.

Lux, that is. Lumens per square meter. The actual effectiveness of a light at…you know…LIGHTING things.

So, I thought to myself, “Self, wouldn’t it be interesting to buy some inexpensive lights and make an attempt at some objective measurement?”

I agreed with myself. I especially agreed because Android 4.4 devices can run a cool little Google App called “Science Journal.” The software translates the output from a phone’s ambient light sensor into units of lux. For free (plus the cost of the phone, of course). Neat!

I got onto Amazon, found myself a lighting brand (GBGS) that had numerous fixtures available for fulfillment by Amazon, and spent a few dollars. The reason for choosing fulfillment from Amazon basically comes down to this: I wanted to avoid dealing with an unknown in terms of shipping time. Small vendors can sometimes take a while to pack and ship an order. Amazon, on the other hand, is fast.

The Experiment

Step 1: Find a hallway that can be made as dark as possible – ideally, dark enough that a light meter registers 0 lux.

Step 2: At one end, put the light meter on a stand. (A mic stand with a friction clip is actually pretty good at holding a smartphone, by the way.)

Step 3: At the other end, situate a lighting stand with the “fixture under test” clamped firmly to that stand.

Step 4: Measure the distance from the lighting stand to the light meter position. (In my case, the distance was 19 feet.)

Step 5: Darken the hallway.

Step 6: Set the fixture under test to maximum output using a DMX controller.

Step 7: Allow the fixture to operate at full power for roughly 10 minutes, in case light output is reduced as the fixture’s heat increases.

Step 8: Ensure the fixture under test is aimed directly at the light meter.

Step 9: Note the value indicated by the meter.

Important Notes

A relatively long distance between the light and the meter is recommended. This is so that any positioning variance introduced by placing and replacing either the lights or the meter has a reduced effect. At close range, a small variance in distance can skew a measurement noticeably. At longer distances, that same variance value has almost no effect. A four-inch length difference at 19 feet is about a 2% error, whereas that same length differential at 3 feet is an 11% error.

It’s important to note that the hallway used for the measurement had white walls. This may have pushed the readings higher, as – similarly to audio – energy that would otherwise be lost to absorption is re-emitted and potentially measurable.

It was somewhat difficult to get a “steady” measurement using the phone as a meter. As such, I have estimated lux readings that are slightly lower than the peak numbers I observed.

These fixtures may or may not be suitable for your application. These tests cannot meaningfully speak to durability, reliability, acceptability in a given setting, and so on.

The calculation for 1 meter lux was as follows:

19′ = 5.7912 m

5.7912 = 2^2.53 (2.53 doublings of distance from 1m)

Assumed inverse square law for intensity; For each doubling of distance, intensity quadruples.

Multiply 19′ lux by 4^2.53 (33.53)

Calculated 1 meter lux values are just that – calculated. LED PAR lights are not a point-source of light, and so do not behave like one. It requires a certain distance from the fixture for all the emitters to combine and appear as though they are a single source of light.

The Data

The data display requires Javascript to work. I’m sorry about that – I personally dislike it when sites can’t display content without Javascript. However, for the moment I’m backed into a corner by the way that WordPress works with PHP, so Javascript it is.


Ascending sort by:


The Basics Of Live-Sound “Nerdery”

I made a book, and now I’m making it free.

Please Remember:

The opinions expressed are mine only. These opinions do not necessarily reflect anybody else’s opinions. I do not own, operate, manage, or represent any band, venue, or company that I talk about, unless explicitly noted.

fadersWant to use this image for something else? Great! Click it for the link to a high-res or resolution-independent version.

Back in 2012, I compiled some of my writings into the form of an actual book. The first part was all about the quantitative material behind noise-louderization – the math and science of audio, that is – and the second part was commentary on the concrete realities of sound in actual rooms with actual bands.

I put the book up for sale, and it didn’t do well. I hadn’t done much of anything to build an audience, and my marketing efforts were very weak. (My total sales were three copies.) For years, the poor thing has been languishing behind a “paywall,” not accomplishing much for anyone.

Today that changes. My hope is that making the thing free will allow more people to enjoy it.

In a lot of ways, the book is a precursor to this site. Many of the themes and topics should be quite familiar to regular visitors. As a stylistic note, readers may find that I use parenthetical statements in much the same way as J.J. Abrams used lens flares in the first “Star Trek” reboot film.

So, here you go:

Download PDF


Comb Filtering By The Numbers

Shorter delays mean higher initial nulls, and wider spacing.

Please Remember:

The opinions expressed are mine only. These opinions do not necessarily reflect anybody else’s opinions. I do not own, operate, manage, or represent any band, venue, or company that I talk about, unless explicitly noted.

combWant to use this image for something else? Great! Click it for the link to a high-res or resolution-independent version.

Comb filtering. The weird, hollow sound. The heart of the flanger’s “747 flying overhead” effect. The annoying airhose-esque noise.

What is it? Where does it come from? Why does it behave like it does?

Phase

The heart of comb filtering is phase – that is, a time-arrival difference between two sonic events of the same frequency. For instance, here are two events (at an arbitrary frequency) that have no time difference at all. Don’t worry about all the symbols and numbers, just look at the lines on the graph.

inphase

If these events are mathematically combined, they constructively interfere, like this (the orange trace):

inphasesum

Now, let’s make one of the events “late” when compared to the other. Specifically, let’s make it late enough that it’s completely out of phase. When one event’s amplitude is positive, the other event’s amplitude is the precise negative. This is a phase difference of 1/2 cycle, or 180 degrees.

outofphase

If those two events are combined, say, by arriving at a listener’s ear canal, or via a summing operation in a console, you get cancellation at the frequency in question:

outofphasesum

If the delay is reduced, then the cancellation isn’t complete.

partialdestructivesum

More Content

Now then.

Let’s say that the example above was a 1 kHz tone. A wave with a frequency of 1 kHz requires 1 ms to complete a full cycle. A half cycle, then, is half the time, or 0.5 ms. If you take two 1 kHz signals, delay one 0.5 ms, and then combine them, the output signal should be silence. The signal that’s a half cycle late is fully negative when the undelayed signal is fully positive.

Now, let’s imagine a different set of signals. Each signal contains three, pure tones: 1, 2, and 3 kHz. As before, 1 kHz has a period (a cycle time) of 1 ms, whereas the 2 kHz wave cycles twice as fast, and 3 kHz cycles three times as fast. Let’s delay one signal 0.5 ms again.

What happens is that the delayed signal is late by a different number of cycles at each frequency.

1 kHz : 0.5 ms/delay * 1 cycles/ms = 0.5 cycles.
2 kHz : 0.5 ms/delay * 2 cycles/ms = 1 cycle.
3 kHz : 0.5 ms/delay * 3 cycles/ms = 1.5 cycles.

The 1 kHz tone cancels, as we would expect. The 2 kHz wave does NOT cancel. Because the delay is one full cycle, the effect is constructive addition – after the first 0.5 ms has passed, of course. Where things get very interesting is at 3 kHz, because that’s where another cancellation occurs. The 3 kHz tone’s amplitude goes one full cycle, and then only gets halfway when its delayed version begins. Because 3 kHz is at a halfway point when its delayed version starts, the 3 kHz tone also cancels.

You can begin to imagine what would happen if the two signals had content all the way up through the end of the audible spectrum. The phase difference would continue to “wrap” from all the way out of phase to “in phase, but late,” and back again.

Locating The Dips

An important note:

For these examples, I’m working in an electronic system where wavelength doesn’t matter. In a real room, with sound pressure waves in air, the numbers get to be a bit different. Sound travels at about 1126 feet/ second in the air, so a 1 kHz wave is physically 1.126 feet long. For sounds that are physically combining in air, the actual wavelength “in the room,” and the delay time corresponding to that are what determine where comb filtering occurs.

At the same time, rounding things off so that 1 ms = 1 foot will get you into the ballpark, and make math easier. Just be aware that the rounding error is occurring.


Comb filtering can occur in all manner of “same signal, but late” situations. One common situation is two microphones picking up the same sound, at a similar amplitude, but with some spacing between the mics.

Let’s assume that our two mics are 2 feet apart. We’ll use the 1 ms = 1 foot rounding to keep the math easy, recognizing that the numbers won’t be exact. A sound arrives at one mic, and then travels onward to the other. The mics are then summed in the console to feed the PA.

For any given delay time, there is a lowest frequency of complete cancellation. This is the frequency which has a cycle time that is twice the delay. At that frequency, one delay time is half a cycle. Frequencies lower than the first cancellation will all be somewhat out of phase, of course, but to lesser degrees.

In more practical terms, this means that (1/[delay in seconds])/2 will give you the frequency with the first complete cancellation. For the above example this works out to (1/[0.002])/2 = 250 Hz.

Above the first cancellation, the cancellation repeats as the phase relationship “wraps” from fully out of phase, to late but in phase, and back again.

These cancellations occur at each odd-numbered harmonic of the first cancellation frequency. Each odd-numbered harmonic is a frequency that is some number of cycles + 1/2 cycle at the delay time.

For our example, this means:

First cancellation – 250 Hz.
Other cancellations – 750 Hz, 1250 Hz, 1750 Hz, 2250 Hz, 2750 Hz, 3250 Hz, 3750 Hz, and so on.

Below is a calculator to help you. It takes a delay time in milliseconds, finds the first cancellation, and then finds the upper cancellations through the audible frequency range.

First cancellation: 1/[]/2 = Hz

Additional cancellations:


Double Hung Discussion

It’s not magic, and it may not be for you. It works for me, though.

Please Remember:

The opinions expressed are mine only. These opinions do not necessarily reflect anybody else’s opinions. I do not own, operate, manage, or represent any band, venue, or company that I talk about, unless explicitly noted.

double-hungWant to use this image for something else? Great! Click it for the link to a high-res or resolution-independent version.

On the heels of my last article, it came to may attention that some folks were – shall we say – perplexed about my whole “double hung” PA deployment. As can be the case, I didn’t really go into any nuance about why I did it, or what I expected to get out of it. This lead some folks to feel that it was a really bizarre way to go about things, especially when a simpler solution might have been a better option.

The observations I became aware of are appropriate and astute, so I think it’s worth talking about them.

Why Do It At All?

First, we can start with that logistics thing again.

When I put my current system together, I had to consider what I was wanting to do. My desire was to have a compact, modular, and flexible rig that could “degrade gracefully” in the event of a problem. I also had no desire to compete with the varsity-level concert systems around town. To do so would have required an enormous investment in both gear and transport, one that I was unwilling (and unable) to make.

What I’ve ended up with, then, is a number of smaller boxes. If I need more raw output, I can arrange them so that they’re all hitting the same general area. I also have the option of deploying for a much wider area, but with reduced total output capability. I wouldn’t have that same set of options with a small number of larger, louder enclosures.

That’s the basic force behind why I have the rig that I have. Next come the more direct and immediate issues.

The first thing is just a practical consideration: Because my transport vehicle isn’t particularly large, I don’t really have the necessary packing options required to “leave gear on the truck.” If I’m getting the rig out, I might as well get all of it out. This leads to a situation where I figure that I might as well find a way to deploy everything all the time. The gear is meant to make noise, not sit around. “Double hung” lets me do that in a way that makes theoretical sense (I’ll say more on why in a bit).

The second reason is less practical. I have a bit of a penchant for the unconventional and off-the-wall. I sometimes enjoy experiments for the sake of doing them, and running a double hung system is just that kind of thing. I like doing it to find out what it’s like to do it.

Running double hung is NOT, by any means, more practical than other deployments. Especially if you’re new to this whole noise-louderization job, going with this setup is NOT some sort of magical band-aid that is going to fix your sound problems. Also, if you’re getting good results with a much simpler way of doing things, going to the extra trouble very well may not be worth it.

At the same time, though, the reality of making this kind of deployment happen is not really all that complicated. You can do it very easily by connecting one pair to the left side of your main mix, and the other pair to the right side. Then, you just pan to one side or the other as you desire.

System Output And Response

Up above, I mentioned that running my system as a double hung made sense in terms of audio theory. Here’s the explanation as to why. It’s a bit involved, but stick with me.

I haven’t actually measured the maximum output of my FOH mid-highs, but Turbosound claims that they’ll each make a 128 dB SPL peak. I’m assuming that’s at 1 meter, and an instantaneous value. As such, my best guess at their maximum continuous performance, run hard into their limiters, would be 118 dB SPL at 1 meter.

If I run them all together as one large rig, most people will probably NOT hear the various boxes sum coherently. So, the incoherent SPL addition formula is what’s necessary: 10 Log10[10^(dB SPL/ 10) + 10^(dB SPL/ 10)…]. What I put into Wolfram Alpha is 10 Log10[10^11.8 + 10^11.8 + 10^11.8 + 10^11.8].

What I get out is a theoretical, total continuous system output of 124 dB SPL at 1 meter, ignoring any contribution from the subwoofers.

At this point, you would be quite right to say that I can supposedly get to that number in one of two ways. The first, simple way, is to just put everything into all four boxes. The second, not simple way is to put some things in some boxes and not in others. Either way, the total summed sound pressure should be basically the same. The math doesn’t care about the per-box content. So, why not just do it simply?

Because there’s more to life than just simply getting to the maximum system output level.

By necessity of there being physical space required for the speakers to occupy, the outer pair of enclosures simply can’t create a signal that arrives at precisely the same moment as the signal from the inner pair, as far as the majority of the audience can perceive. Placed close together, the path-length differential between an inner box and an outer box is about 0.0762 meters, or 3 inches.

That doesn’t seem so bad. The speed of sound is about 343 meters/ second in air, so 0.0762 meters is 0.22 ms of delay. That also doesn’t seem so bad…

…until you realize that 0.22 ms is the 1/2 cycle time of 2272 Hz. With the outer boxes being 1/2 cycle late, 2272 Hz would null (as would other frequencies with the same phase relationship). If everything started as measuring perfectly flat, introducing that timing difference into a rig with multiple boxes producing the same material would result in this transfer function:

combfiltering0.22ms

Of course, everything does NOT start out as being perfectly flat, so that craziness is added onto whatever other craziness is already occurring. For most of the audience, plenty of phase weirdness is going on from any PA deployed as two, spaced “stacks” anyway. To put it succinctly, running everything everywhere results in even more giant holes being dug into the critical-for-intelligibility range than were there before.

Running double hung, where the different pairs of boxes produce different sounds, prevents the above problem from happening.

So, when I said that I was running double hung for “clarity,” I was not doing it to fix an existing clarity problem. I was preventing a clarity problem from manifesting itself.

Running absolutely everything into every mid-high, and then having all those mid-highs combine is a simple way to make a system’s mid-highs louder. It’s also a recipe for all kinds of weird phase interactions. These interactions can be used intelligently (in an honest-to-goodness line-array, for instance), but for most of us, they actually make life more difficult. Louder is not necessarily better.

More On Output – Enough Rig For The Gig?

For some folks reading my previous installment, there was real concern that I hadn’t brought enough PA. They took a gander at the compactness of the rig, and said, “There’s no way that’s going to get big-time sound throughout that entire park.”

The people with that concern are entirely correct.

But “rock and roll level everywhere” was not at all what I was trying to do.

The Raw Numbers

What I’ve found is that many people do NOT actually want everything to be “rock and roll” loud over every square inch of an event area. What a good number of events actually want is a comfortable volume up close, with an ability to get away from the noise for the folks who aren’t 100% interested. With this being the case, investing in a system that can be clearly heard at a distance of one mile really isn’t worthwhile for me. (Like I said, I’m not trying to compete with a varsity-level sound company.)

Instead, what I do is to deploy a rig that’s in close proximity to the folks who do want to listen, while less interested people are at a distance. Because the folks who want more volume are closer to the PA, the PA doesn’t have to have crushing output overall. For me, the 110 dB SPL neighborhood is plenty loud, and I can do that for the folks nearby – by virtue of them being nearby.

Big systems that have to cover large areas often have the opposite situation to deal with: The distance differential between the front row and the back row can actually be smaller, although the front row is farther away from the stacks in an absolute sense. With my rig, the people up close are probably about three meters from the PA. The folks far away (who, again, aren’t really interested) might be 50 meters away. That’s more than a 16-fold difference. At a bigger show, there might be a barricade that’s 10 meters from the PA, with the main audience extending out to 100 meters. That’s a much bigger potential audience, but the difference in path lengths to the PA is only 10-fold.

Assuming that the apparent level of the show drops 6 dB for every doubling of distance, my small show loses about 24 decibels from the front row to the folks milling around at 50 meters. The big show, on the other hand, loses about 20 dB. (But they have to “start” much louder.)

That is, where the rubber hits the road is how much output each rig needs at 1 meter. At the big show, they might want to put 120 dB SPL into the front seats. To do that, the level at 1 meter has to be 140 dB. That takes a big, powerful PA. The folks in the back are getting 100 dB, assuming that delays aren’t coming into the picture.

For me to do a show that’s 110 dB for the front row, my PA has to produce about 119 dB at 1 meter. That’s right about what I would expect my compact setup to be able to do, with a small sliver of headroom. At 50 meters, my show has decayed to a still audible (but not “rock show loud”) 86 dB SPL.

That’s what I can do, and I’ve decided to be happy with it – because the folks I work with are likely to be just as happy with that as I am. People don’t hire me to cover stadiums or have chest-collapsing bass. They hire me because they know I’ll do everything in my power to get a balanced mix at “just enough” volume.

The Specifics Of The Show

Ultimately, the real brass tacks are to be found in what the show actually needed.

The show did not need 110 dB SPL anywhere. It needed a PA that sounded decent at a moderate volume.

The genre was folksy, indie material. A 110 dB level would have been thoroughly inappropriate overkill. At FOH control, the show was about 80 – 90 dB, and that was plenty. There were a few times where I was concerned that I might have been a touch too loud for what was going on. In that sense, I had far more than enough PA for raw output. I could have run a single pair of boxes and been just fine, but I didn’t want to get all the speakers out of the van and not use them. As I said before, I chose “double hung” to use all my boxes, and to use them in the way that would be nicest for people’s ears.


If you’re curious about running a double hung setup, I do encourage you to experiment with it. Curiosity is what keeps this industry moving. At the same time, you shouldn’t expect it to completely knock you off your feet. If you have a good-sounding system that runs everything through one pair of mains, adding another pair just to split out some sources is unlikely to cause a cloud-parting, ligh-ray-beaming experience of religious proportions. Somewhat like aux-fed subwoofers, going double hung is a taste-dependent route to accomplishing reinforcement for a live event. For me, it solves a particular problem that is mostly logistical in nature, and it sounds decent doing it.


A Statistics-Based Case Against “Going Viral” As A Career Strategy

Going viral is neat, but you can’t count on it unless you can manage to do it all the time.

Please Remember:

The opinions expressed are mine only. These opinions do not necessarily reflect anybody else’s opinions. I do not own, operate, manage, or represent any band, venue, or company that I talk about, unless explicitly noted.

normaldistributionWant to use this image for something else? Great! Click it for the link to a high-res or resolution-independent version.

“Going viral is not a business plan.” -Jackal Group CEO Gail Berman

There are plenty of musicians (and other entrepreneurs, not just in the music biz) out there who believe that all they need is “one big hit.” If they get that one big hit, then they will have sustained success at a level that’s similar to that of the breakthrough.

But…

Have you ever heard of a one-hit wonder? I thought so. There are plenty to choose from: Bands and brands that did one thing that lit up the world for a while, and then faded back into obscurity.

Don’t get me wrong. When something you’ve created really catches on, it’s a great feeling. It DOES create momentum. It IS helpful for your work. It IS NOT enough, though, to guarantee long-term viability. It’s a nice bit of luck, but it’s not a business plan in any sense I would agree with.

Why? Because of an assumption which I think is correct.

Consistency

In my mind, two hallmarks of a viable, long-term, entrepreneurial strategy are:

A) You avoid being at the mercy of the public’s rapidly-shifting attention.

B) Your product, and its positive effect on your business, are consistent and predictable.

Part A disqualifies “going viral” as a core strategy because going viral rests tremendously upon the whims of the public. It’s so far out of your control (as an individual creator), and so unpredictable that it can’t be relied on. It’s as if you were to try farming land where the weather was almost completely random – one day of rain, then a tornado, then a month of scorching heat, then an hour of hail, then a week of arctic freeze, then two days of sun, then…

You might manage to grow something if you got lucky, but you’d be much more likely to starve to death.

Part B connects to Part A. If you can produce a product every day, but you can’t meaningfully predict what kind of revenue it will generate, you don’t have a basis for a business. If your product is completely at the mercy of the public’s attention-span, and will only help you if the public goes completely mad over it, you are standing on very shaky ground. Sure, you may get a surge in popularity, but when will that surge come? Will it be long-term? A transient hit will not keep you afloat. It can give you a nice infusion of cash. It can give you something to build on. It can be capitalized on, but it can’t be counted on.

A viable business rests on things that can be counted on, and this is where the statistics come in. If I reduce my opinion to a single statement, I come up with this:

Long-term business viability is found within one standard deviation, if it’s found at all.

Now, what in blazes does that mean?

One Sigma

When we talk about a “normal distribution,” we say that a vast majority of what we can expect to find – almost all of it, in fact – will be between plus/ minus two standard deviations. A standard deviation is represented as “sigma,” and is a measure of variation. If you release ten songs, and all of them get between 90 and 110 listens every day, then there’s not much variation in their popularity. The standard deviation is small. If you release ten songs, and one of them gets 10,000 listens per day, another gets 100, another gets 20, and so on all over the map, then standard deviation is large. There are wild variations in popularity from song to song.

When I say that “Long-term business viability is found within one standard deviation, if it’s found at all,” what I’m saying is that strategy has to be built on things you can reasonably expect. It’s true that you might have an exceptionally bad day here and there, and you might also have an exceptionally good day, but you can’t build your business on either of those two things. You have to look at what is probably going to happen the majority of the time.

Do I have some examples? You bet!

I once ran a heavily subsidized (we wouldn’t have made it otherwise) venue that admitted all-ages. When it was all over and the dust settled, I did some number crunching. Our average revenue per show was $77. The standard deviation in show revenue was $64. That’s an enormous spread in value. Just one standard deviation in either direction covered a range of revenue from $13 to $141. With a variation that enormous, the only long term strategy would have been to stay subsidized. Not much money was made, and “duds” were plenty common.

We can also look at the daily traffic for this site. In fact, it’s a great example because I recently had an article go viral. My post about why audio humans get so bent out of shape when a mic is cupped took off like a rocket. During the course of the article’s major “viralness” (that might not be a real word, but whatever), this site got 110,000 views. If you look at the same length of time just before the article was published, the site got 373 views.

That’s a heck of an outlier. Even if we keep that outlier in the data and let it push things off to the high side, the average view-count per day is 162, with a standard deviation of over 2000. In that case, the very peak of the article’s viral activity is +22 standard deviations (holy smoke!) from the mean.

I can’t build a business on that. I can’t predict based on that. I can’t assume that anything else will ever do that well. I would never have dreamed that particular article would catch fire as it did. There are plenty of posts on this site that I consider more interesting, yet didn’t have that kind of popularity. The public made their decision, and I didn’t expect it.

It was really cool to go viral, and it did help me out. However, I have not been “crowned king of show production sites,” or anything like that. My day to day traffic is higher than it was before, but my life and the site’s life haven’t fundamentally changed. The day to day is back to normal, and normal is what I can think about in the long-term. This doesn’t mean I can’t dream big, or take an occasional risk – it just means that my expectations have to be in the right place: About one standard deviation. (Actually, less than that.)


Why Do We Use Big Drivers For Low-Frequency Material?

It’s easy to say that we have to move more air, but there’s more to it.

Please Remember:

The opinions expressed are mine only. These opinions do not necessarily reflect anybody else’s opinions. I do not own, operate, manage, or represent any band, venue, or company that I talk about, unless explicitly noted.

driverWant to use this image for something else? Great! Click it for the link to a high-res or resolution-independent version.

There’s a certain intuitiveness to the idea that a subwoofer driver (especially one that radiates directly, as opposed to being horn-loaded) is big. Or rather, that the subwoofer driver has a large diaphragm relative to a high-frequency driver. If you want a low-frequency noise, and you want it loud, it just makes sense that you need something big for making it. Bears, for instance, have lower voices than doormice.

For the average person in entertainment, I don’t really find satisfaction with the standard explanation for why we use big drivers to produce LF information. We say things like, “Ya gotta move more air, dude!” and then move on. Sure we have to move more air, but WHY? It doesn’t help that the topic seems to be avoided by many sites that talk about sound. My guess is that it probably has something to do with the physics being more hairy than a lot of audio humans are ready for. It’s the kind of material that you’d expect to find in acoustical engineering classes, as opposed to a live-sound engineering course. (Acoustical engineering is “classical” engineering, whereas being a sound engineer for entertainment emphasizes equipment operation.)

As such, even folks like me end up “feeling around in the dark” in regards to the question. We know that there’s more to it all, but how it works is tough to piece together.

This article is all about me trying to piece it together. A big “thank you” is due to Jerry McNutt, an honest-to-goodness Product Design Manager at Eminence Loudspeakers. Two years ago(!), he was kind enough to answer some of my questions about this topic, and I’ve been chewing on those answers sporadically since then.

Anyway…

Please be aware that this is a “best attempt.” My conclusions may not be exactly correct, but I don’t have an easy way to really verify them. Treat this all as food for thought seasoned with at least one grain of metaphorical salt.

Sound Intensity vs. Frequency

Intensity is a measure of power over area, or watts applied per square meter at the observation point. Most of us don’t think of sound level in terms of intensity as defined by physics. We’re used to dB SPL. Conversions are definitely possible, but that’s not the point here. The point is that intensity does relate to frequency, and greater intensity means that something is perceived as being louder.

If you want to actually calculate intensity of sound with real units, there’s a fair bit of math involved in figuring out how to do so. The end result of all that figuring still looks a bit intimidating to those of us used to moving no more than three terms around. According to the physics.info site:

I = 2π^2ρƒ^2v∆x^2max

But…if all that’s desired is to make comparisons regarding how intensity varies with frequency, everything that isn’t “ƒ” can be set to a value of 1:

I (abstract comparison) = ƒ^2

If we start with good ol’ 1 kHz as a reference point, the abstract comparison intensity is 1000^2, or 1,000,000. If we go down an octave, the frequency is 500 Hz. Five-hundred squared is 250,000.

In other words, if everything else but frequency is held constant, then going down an octave means the sound intensity drops by a factor of four.

To really drive this home, let’s consider the frequencies of 60 Hz and 6000 Hz. We would generally expect the low side to be produced by a big ol’ subwoofer, and the high side to be in compression-driver territory.

I (abstract comparison) = ƒ^2 = 6000^2 = 36,000,000

I (abstract comparison) = ƒ^2 = 60^2 = 3,600

36,000,000 / 3,600 = 10,000

In terms of power, a factor of 10,000:1 is jaw-dropping. Pushing an itty-bitty compression driver with one watt is common. Pushing one with 10,000 watts, well…

Two vs. Four

From the above, I think you can get an idea of the importance of “moving more air” to keep everything manageable. We have to do something to counteract the intensity drop from lower frequency. It’s actually a multi-factor problem, of course, because real-life tends to be that way. We can move more air by making a driver undergo longer excursion (forward/ back movement), but there’s only so much that’s doable. Closely related to that is more drive power. That’s good, but again, there’s only so much that’s reasonable. If we’re going to shove more air molecules around, we need to also have more diaphragm area.

One of the best tidbits I got from my conversation with Mr. McNutt was in regards to the advantage of using a squared term instead of a linear term. Doubling a driver’s excursion (the linear term) certainly gets you something, but doubling the driver radius (the squared term) gets you much more.

For the sake of argument, let’s simplify a loudspeaker driver’s diaphragm into being a piston that pushes hydraulic fluid around. We’ll conveniently use a driver that starts with 1 mm of excursion, because it will make the math easier. My guess is that most compression drivers can handle rather less excursion than that, but this is just an example. The radius will be 25.4 mm (that’s like a 2″ diameter compression driver, if you want to visualize it).

Displacement Volume = Area * Excursion

Displacement Volume = (pi*25.4mm^2) * 1mm = 2027 mm^3

If we double the linear term to 2 mm of excursion, the displacement doubles to 4054 mm^3. Nice, but if we double the squared term and leave the excursion alone:

Displacement Volume = (pi*50.8mm^2) * 1mm = 8107 mm^3

That’s a fourfold increase in the amount of fluid the piston moved. When it comes to loudspeakers, making a small driver have a very long excursion is impractical, but making a driver with a larger surface area is commonplace. So, if we consider an 18″ diameter subwoofer (228.6 mm radius) that can handle an excursion of 8 mm:

Displacement Volume = (pi*228.6mm^2) * 8mm = 1313386 mm^3

That’s 648 times more displacement, gotten mostly by making the driver bigger.

I can’t say exactly how all this works out with real drivers, real air, and the real equation for intensity. However, even with rough approximations it seems pretty clear that it’s much easier to move a lot more air if you have a big diaphragm available. The squared term is very important in getting the necessary results.